

Avalanche (AVAX) has been trading inside a bullish pattern since May 12. The bullish RSI readings suggest that it will soon make its fourth breakout attempt.
AVAX has been falling since reaching an all-time high price of $151.22 in Nov. 2021. The downward movement led to a low of $13.72 in June 2022. This amounted to an 89% drop measuring from the high.
The price is approaching the $12 horizontal area. This is a crucial area since it had previously acted as resistance in Aug. 2020 and then turned to support in July 2021.

Will AVAX break out?
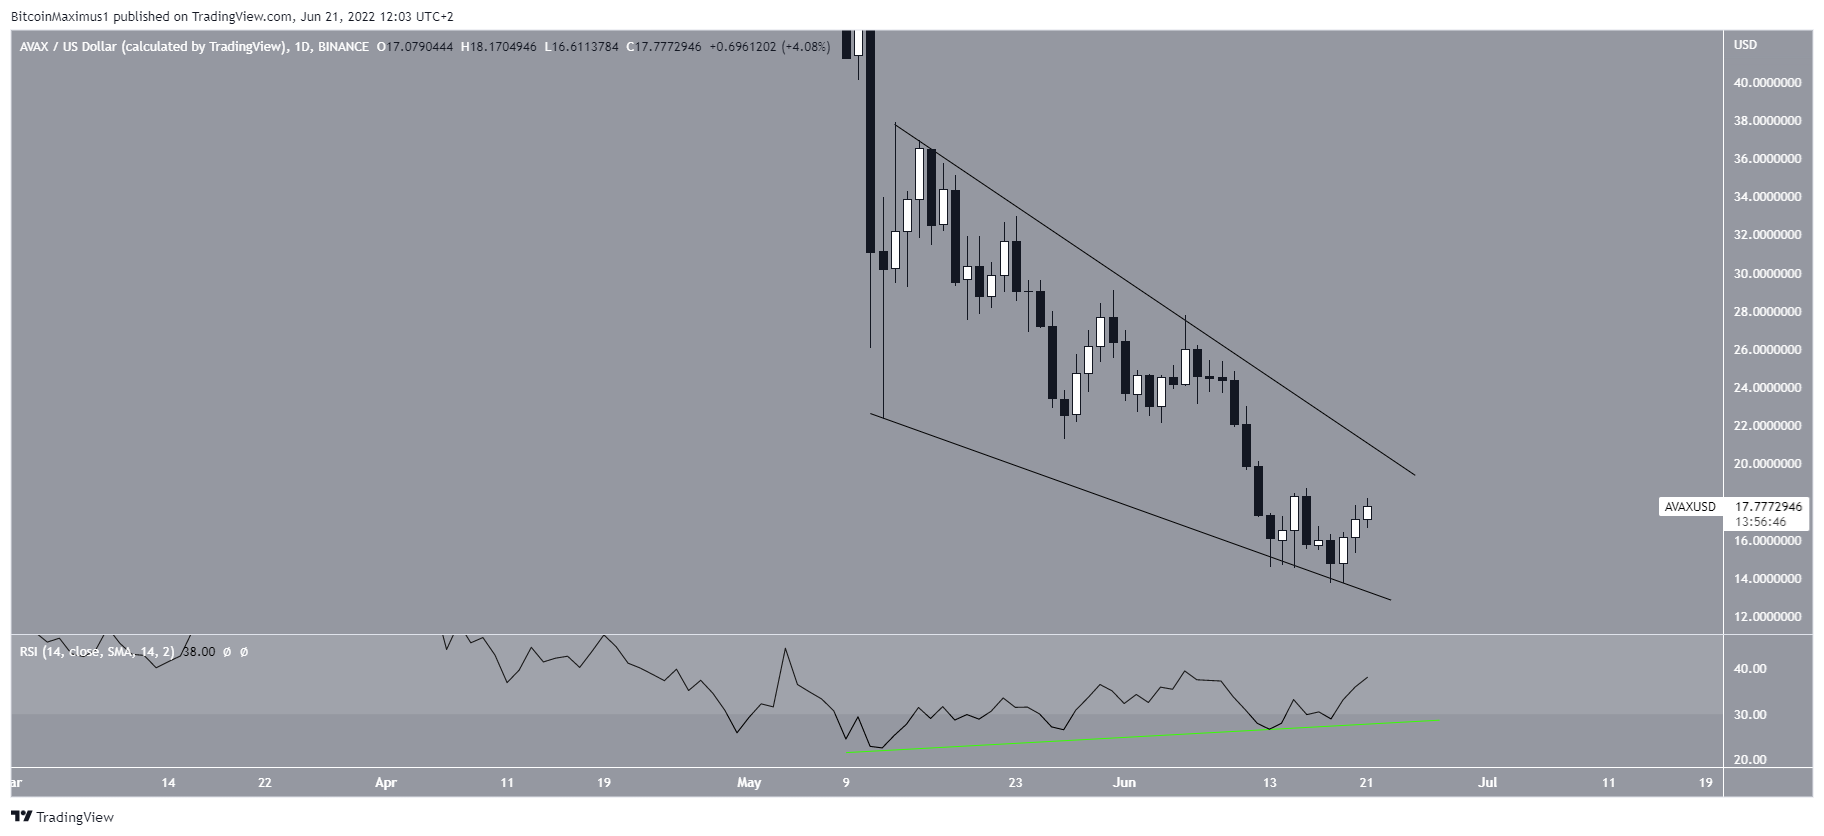
The daily chart shows that the price has been falling inside a descending wedge since May 12. The descending wedge is considered a bullish pattern, meaning that a breakout from it would be expected.
Additionally, the daily RSI has generated bullish divergence, supporting the possibility of a breakout.
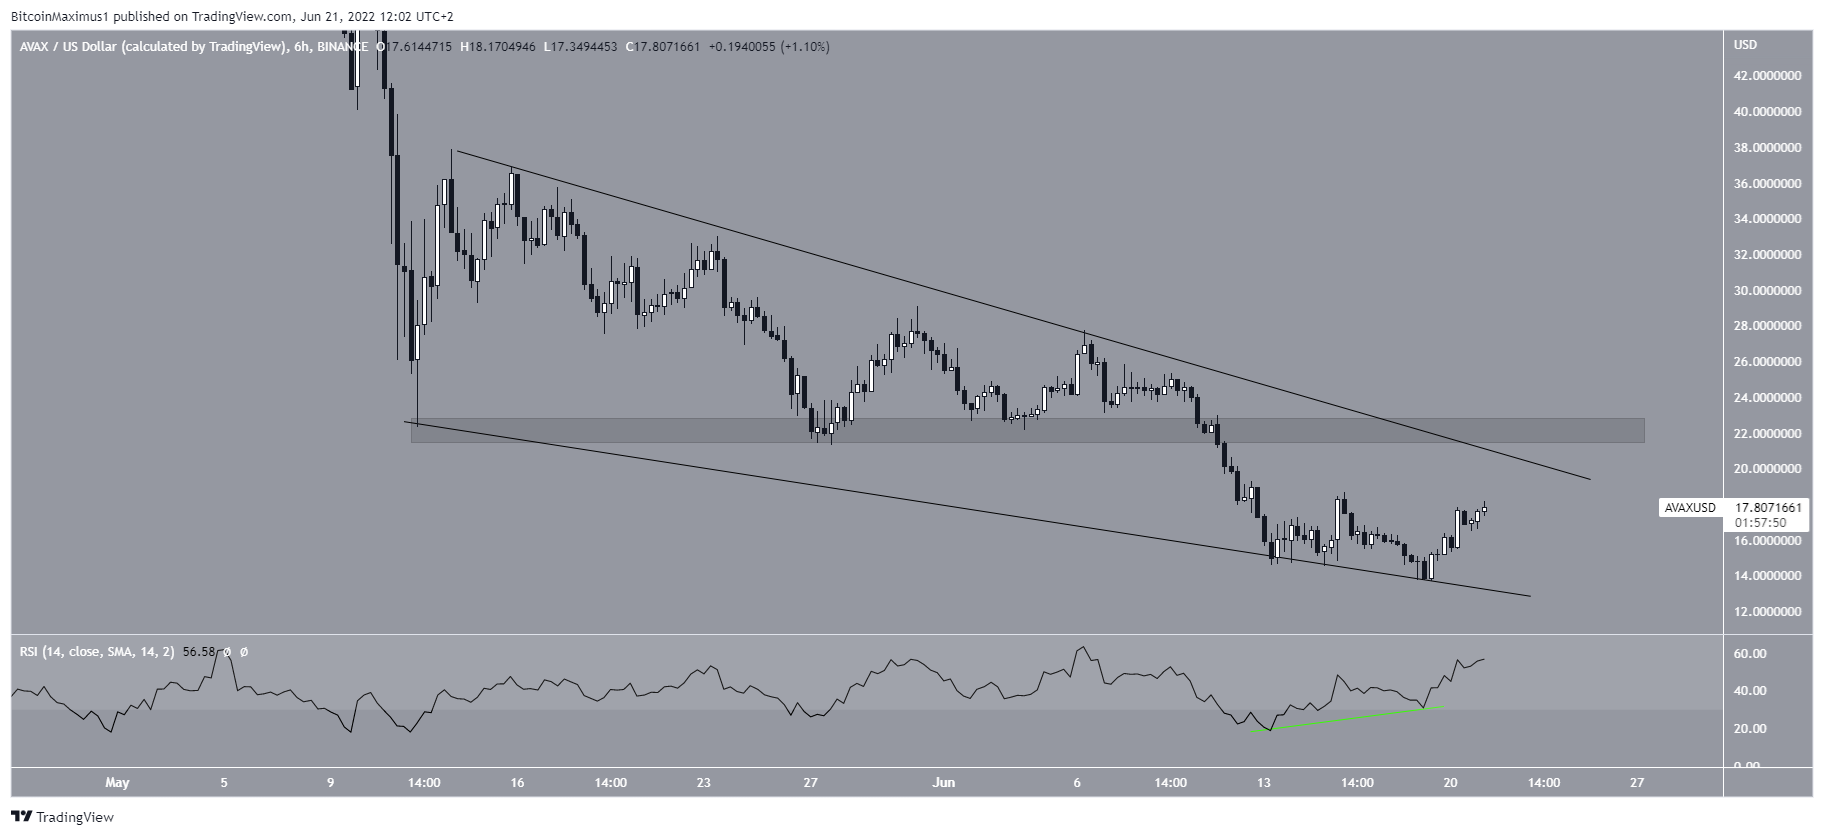
Next, the six-hour chart supports the finding from the daily one.
Similar to the daily one, the RSI has generated bullish divergence during the two most recent touches of the support line.
Currently, the price is approaching the resistance line of the wedge at $20.
In order for the bullish reversal to be confirmed, AVAX has to break out from the wedge and reclaim the $22 area afterward.
Wave count analysis
Cryptocurrency trader @JacobEmmerton tweeted a chart of AVAX, which suggests a strong upward movement will follow once the current decrease is done.

Since the tweet, the target has been reached and AVAX bounced considerably afterward.
As for the future movement, there are two main possibilities.
The first one suggests that the current increase is part of wave four of a five-wave downward movement (black). In this case, the price would be expected to increase towards $39 but would then decrease to another low.
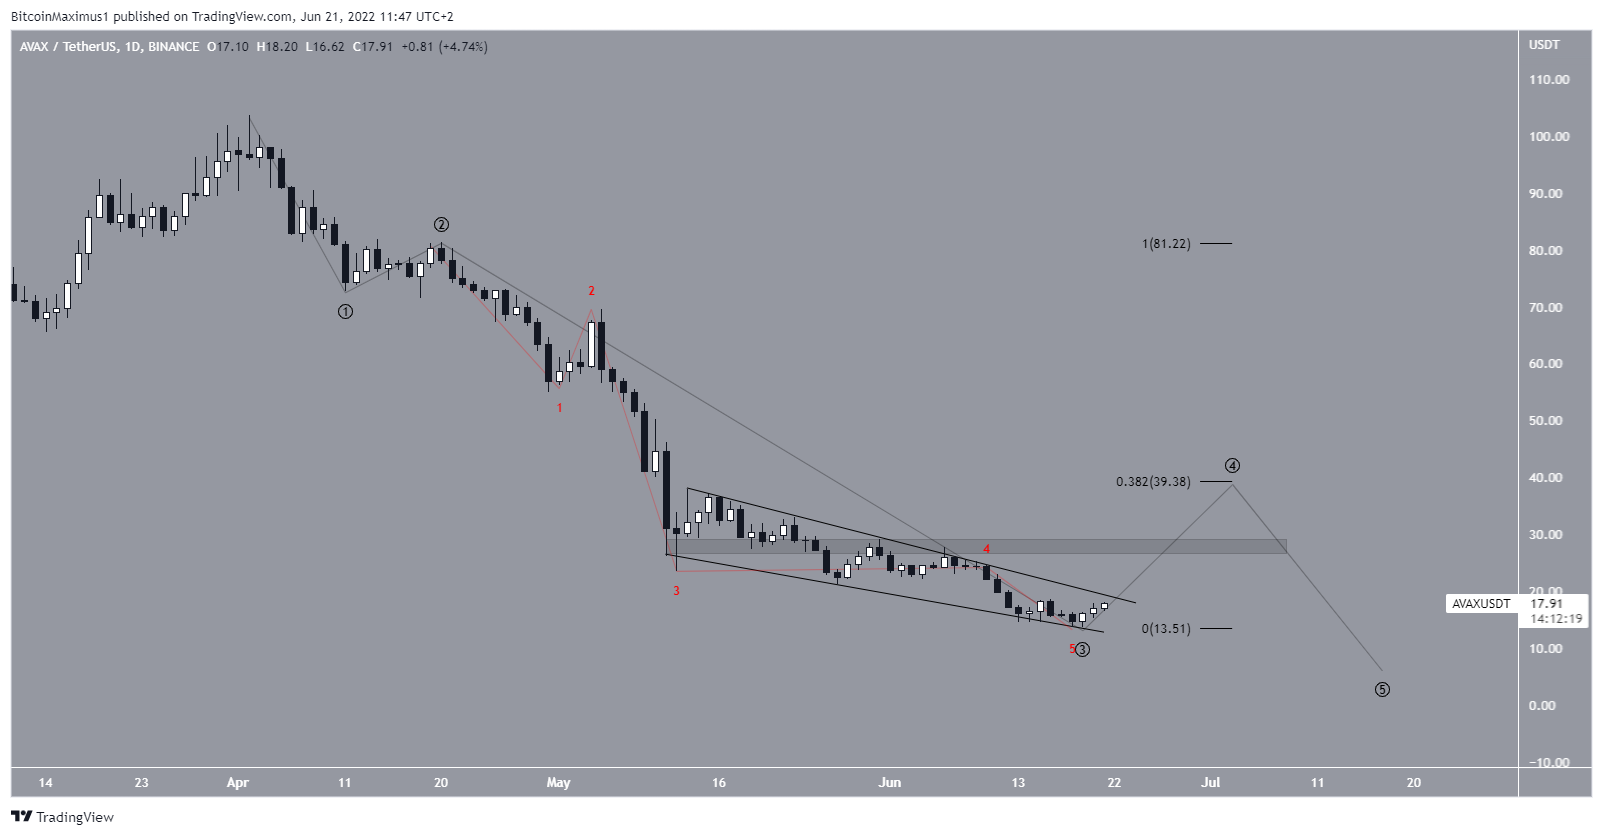
The second one suggests that the price has already completed a five wave downward movement and has now begun a long-term bullish trend reversal. In this case, the price would break out from the wedge and increase well above $39.
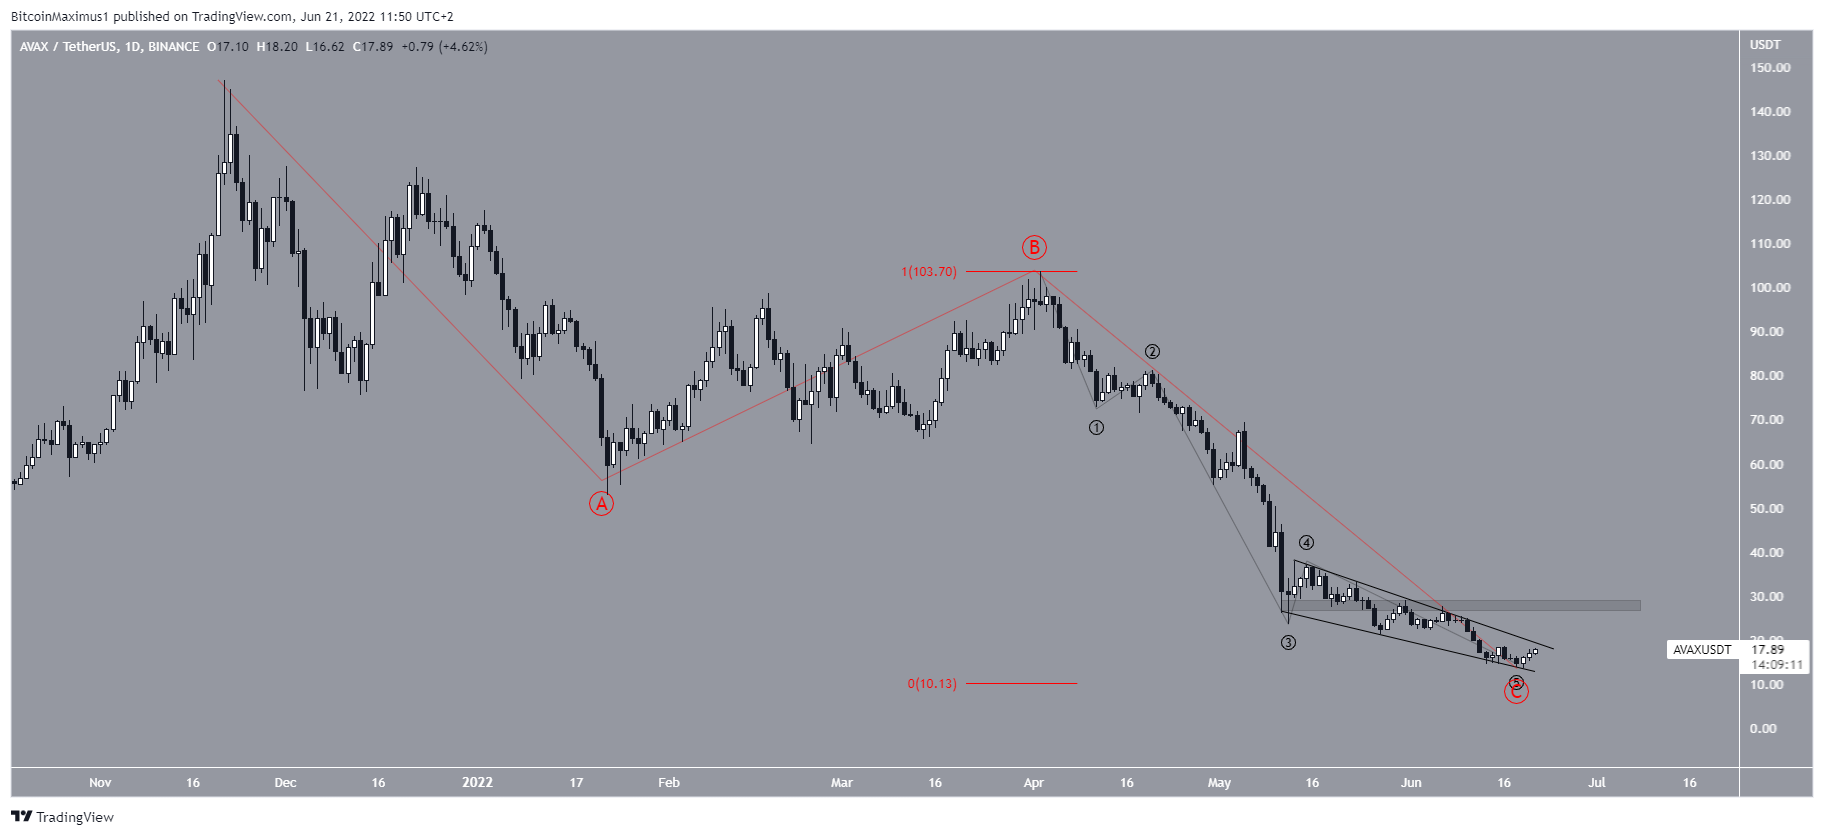
In any case, it seems that a short-term breakout is very likely, and so is a longer-term low. If the entire drop since the all-time high is an A-B-C corrective structure, waves A:C would have a 1:1 ratio at a low of $10.10, which is slightly above the current low.
So, it seems that a bottom is very close.
For Be[in]Crypto’s latest bitcoin (BTC) analysis, click here
Trusted
Disclaimer
In line with the Trust Project guidelines, this price analysis article is for informational purposes only and should not be considered financial or investment advice. BeInCrypto is committed to accurate, unbiased reporting, but market conditions are subject to change without notice. Always conduct your own research and consult with a professional before making any financial decisions. Please note that our Terms and Conditions, Privacy Policy, and Disclaimers have been updated.
