

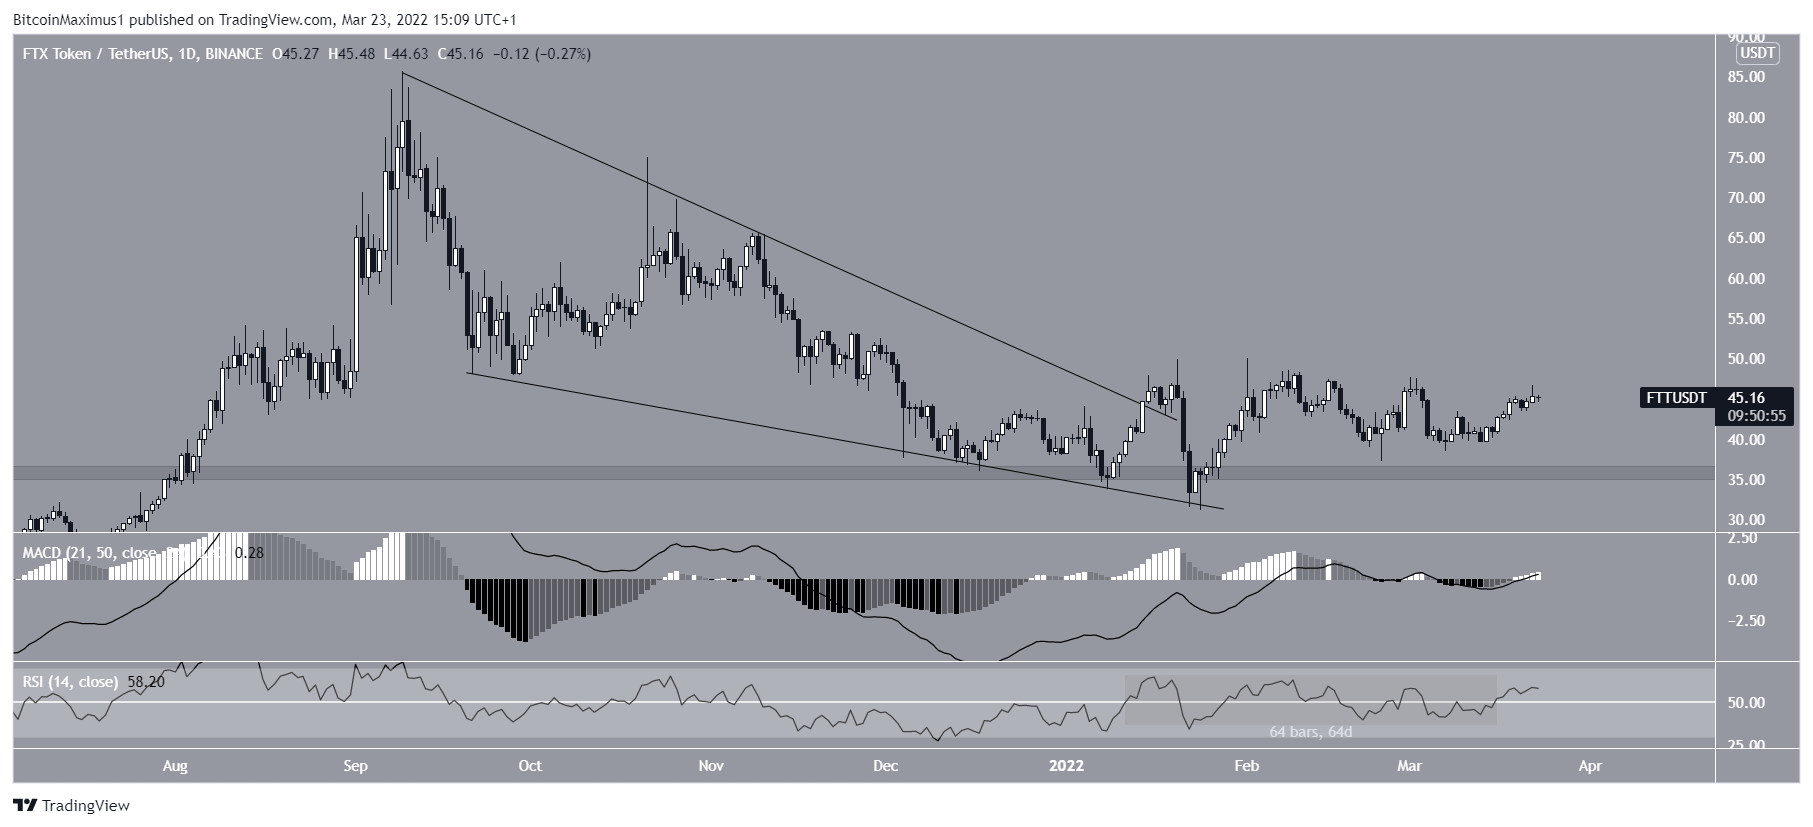
FTT has been decreasing since reaching an all-time high price of $85.74 on Sept 9. The downward movement has so far led to a low of $31.18 on Jan 14 2022.
Afterwards, the price bounced at the $36 horizontal area and has been increasing since.
Since Feb 2021, this area has intermittently acted as both resistance (red icons) and support (green icons). Therefore, it is a crucial area, and as long as the price is trading above it, the trend can be considered bullish.
Measuring from the all-time high price, FTT has so far decreased by 47%.

Future FTT movement
Cryptocurrency trader @CryptoPoseidonn tweeted a chart and said that FTT could increase all the way to $65.

The price action and technical indicators both support the continuation of the upward movement.
In regards to the price action, FTT has broken out from a descending wedge, which is considered a bullish pattern.
As for technical indicators, both the RSI and MACD are moving upwards. Also, the former is above 50 and the latter is positive, both of which are signs of bullish trends.
However, the RSI has been moving above and below 50 for some time, casting some doubt as to whether FTT is trending.
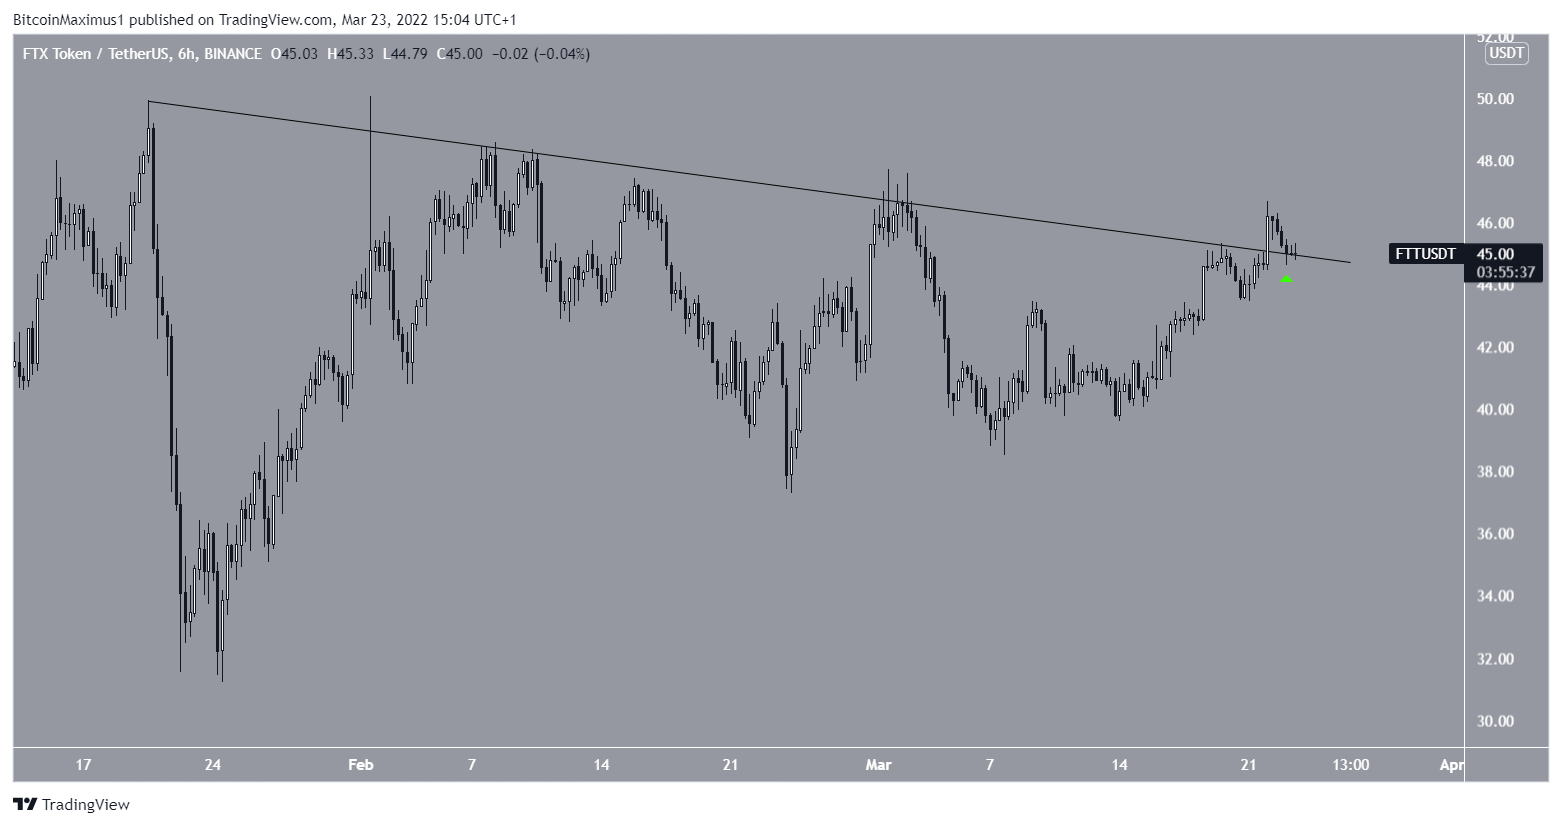
The six-hour chart shows that FTT has broken out from a short-term descending resistance line and potentially validated it as support afterwards (green icon).
If it is successful in doing so, it would be a strong sign that higher prices are on the horizon.
Wave count analysis
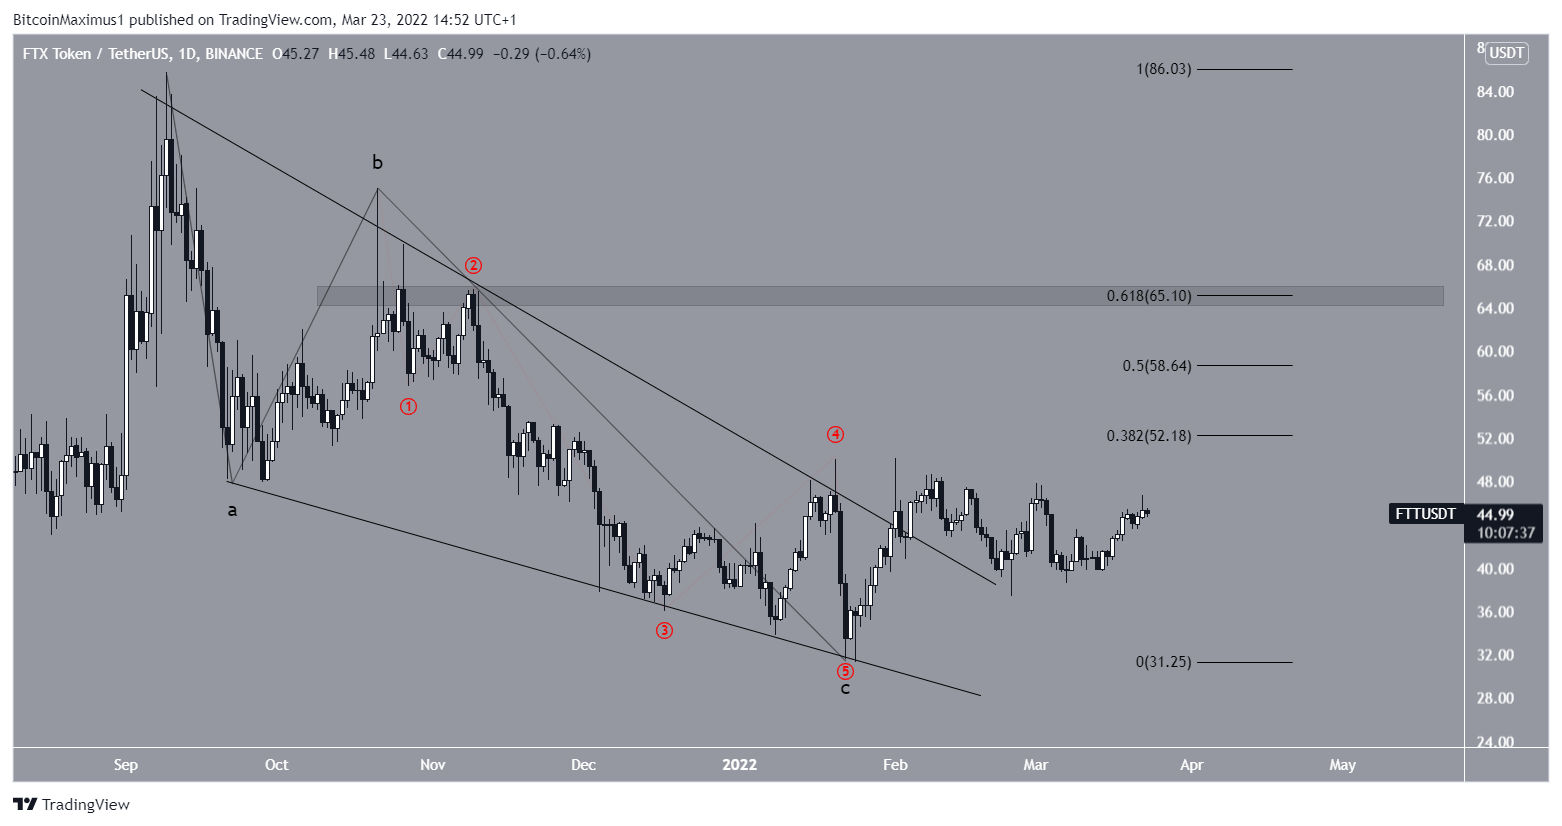
The wave count suggests that measuring from the all-time high, it is possible that FTT has completed an A-B-C corrective structure (black), in which waves A:C have had a 1:1 ratio.
The sub-wave count is given in red.
If correct, an upward movement towards at least $58 would follow. The $65 area also offers strong resistance, since it is both the 0.618 fib retracement resistance level and a horizontal resistance area.
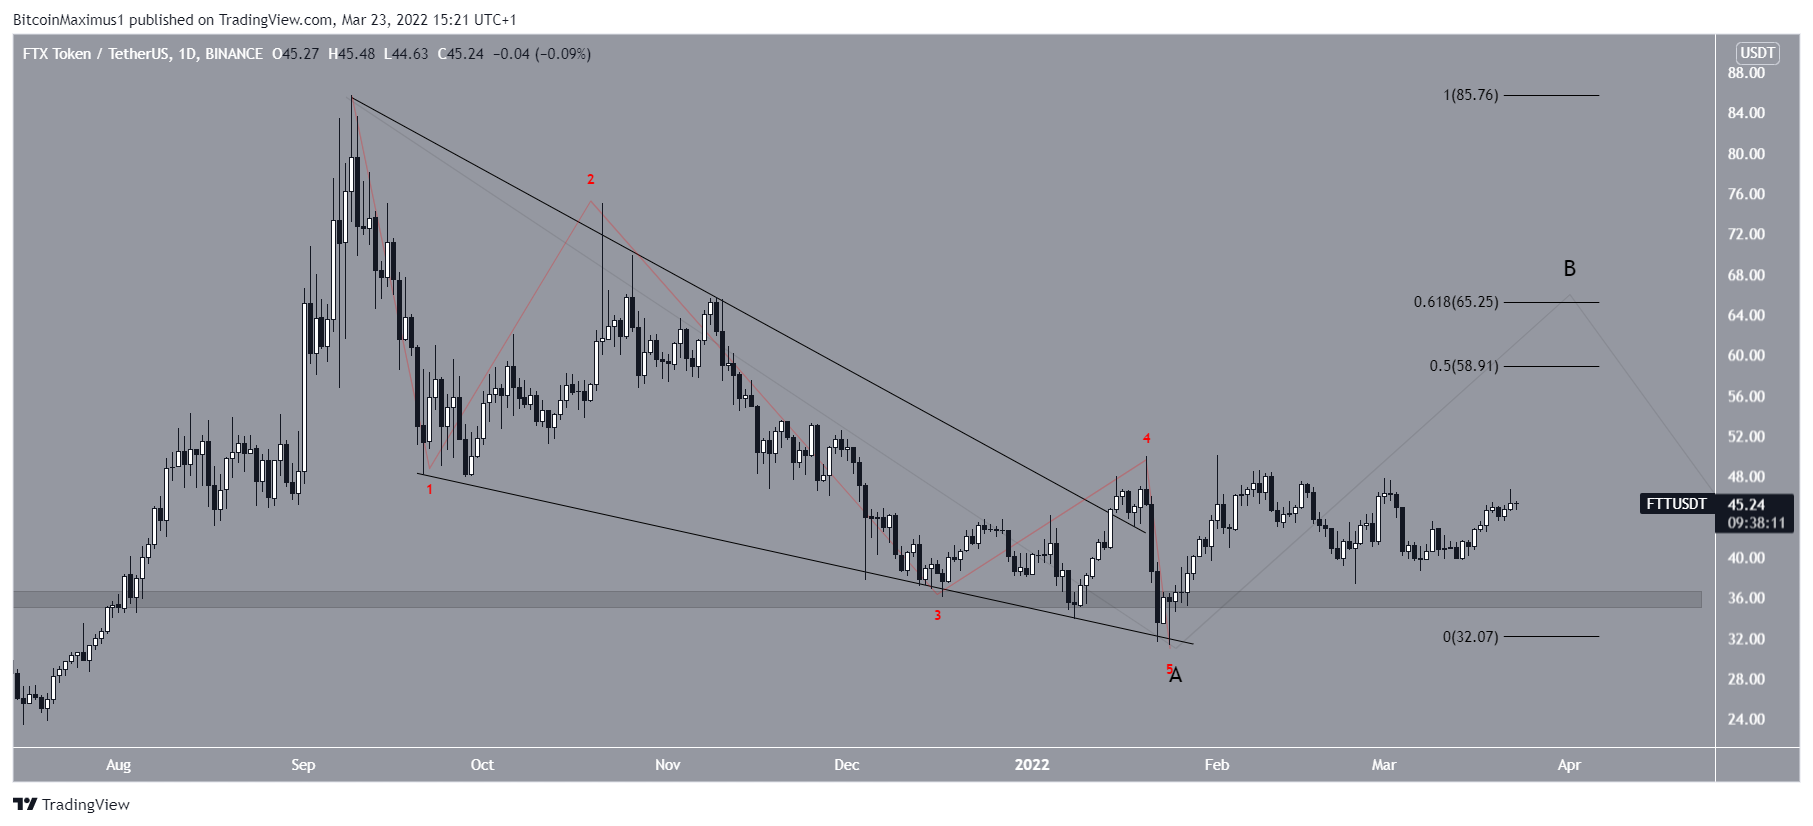
The other possibility would be that the entire decrease is part of a leading diagonal inside a larger wave A.
While this count would also lead to a short-term upward movement towards at least $58, another drop would follow afterwards.
For BeInCrypto’s latest Bitcoin (BTC) analysis, click here
Trusted
Disclaimer
In line with the Trust Project guidelines, this price analysis article is for informational purposes only and should not be considered financial or investment advice. BeInCrypto is committed to accurate, unbiased reporting, but market conditions are subject to change without notice. Always conduct your own research and consult with a professional before making any financial decisions. Please note that our Terms and Conditions, Privacy Policy, and Disclaimers have been updated.
