

Tezos (XTZ) is showing bullish signs by breaking out from a long-term descending resistance line. However, due to neutral technical indicator readings, the bullish trend is not yet confirmed.
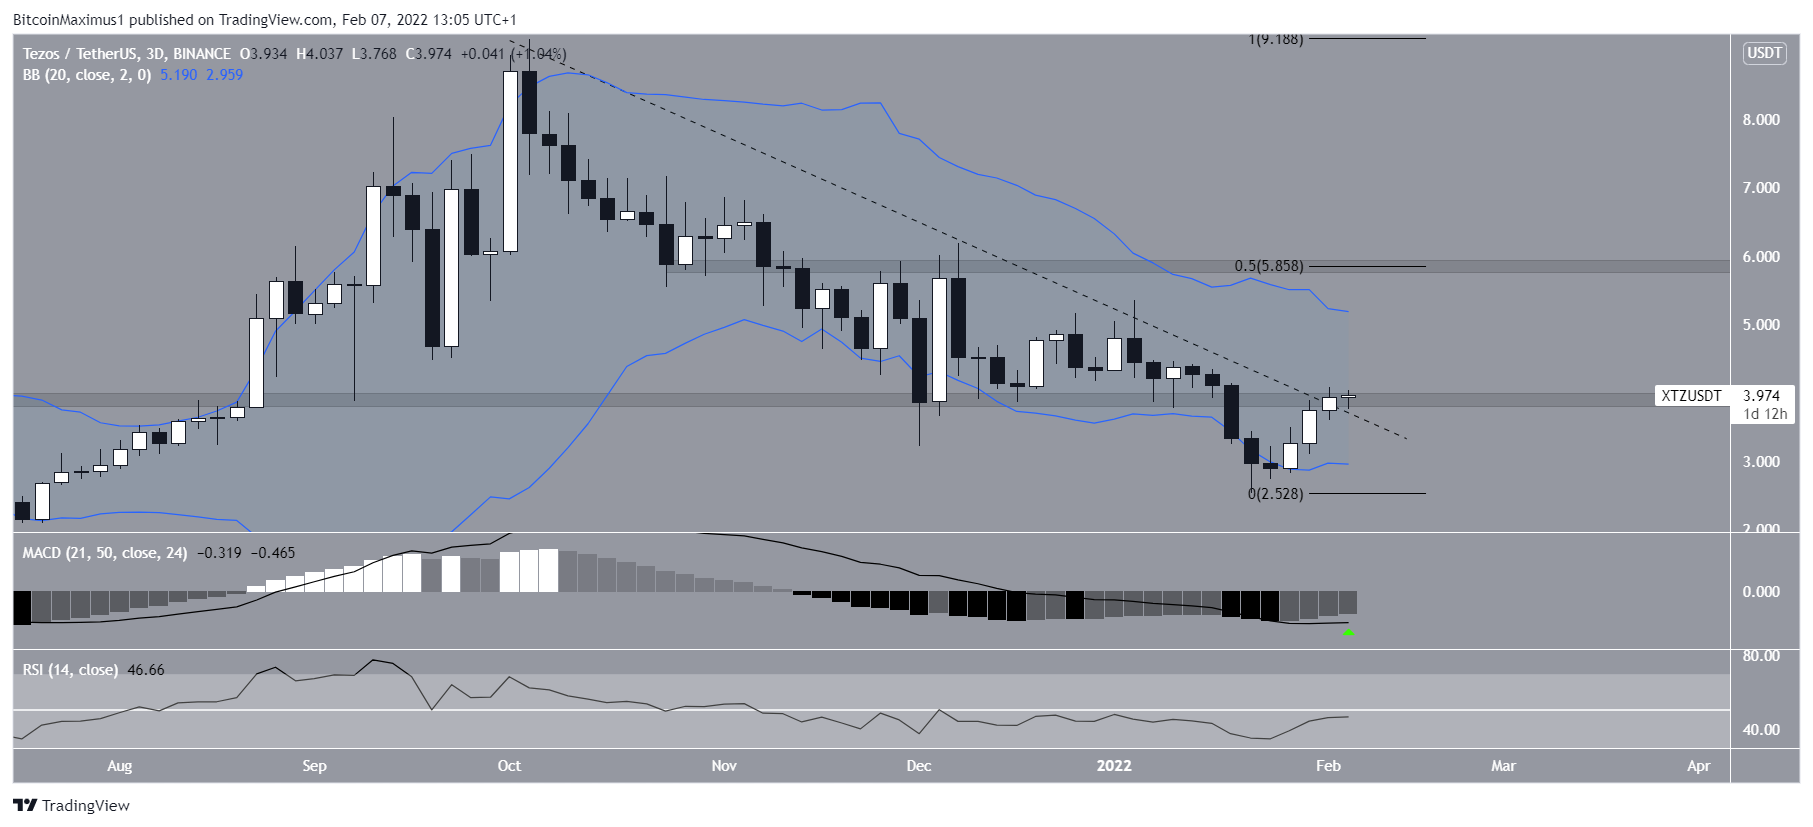
XTZ has been decreasing alongside a descending resistance line since reaching an all-time high price of $9.17 on Oct 14. The downward movement led to a low of $2.53 on Jan 24.
XTZ has been moving upwards since and is currently in the process of breaking out from the aforementioned resistance line, which also coincides with the $3.90 horizontal resistance area.
If the token is successful in moving above it, the next closest resistance would be at $5.85. This is the 0.5 Fib retracement resistance level and coincides with a horizontal resistance area.
Measuring from the current price, it would amount to an increase of 48.55%.

Cryptocurrency enthusiast @one_bald_dude tweeted a chart of XTZ, stating that the token could eventually move towards a new all-time high and go to $11.

In order for this movement to transpire, XTZ has to first clear the $3.85 horizontal area.
Indicator readings
Despite the possibility of a XTZ breakout, technical indicator readings in the daily time-frame are completely neutral.
Firstly the MACD is still negative (green icon), even though it is moving upwards. Similarly, the RSI is moving upwards but is still below 50. Both of these are signs that the trend is gradually turning bullish, but has not turned so yet.
Furthermore, the price is right in the middle of the Bollinger bands, another sign of a neutral trend.
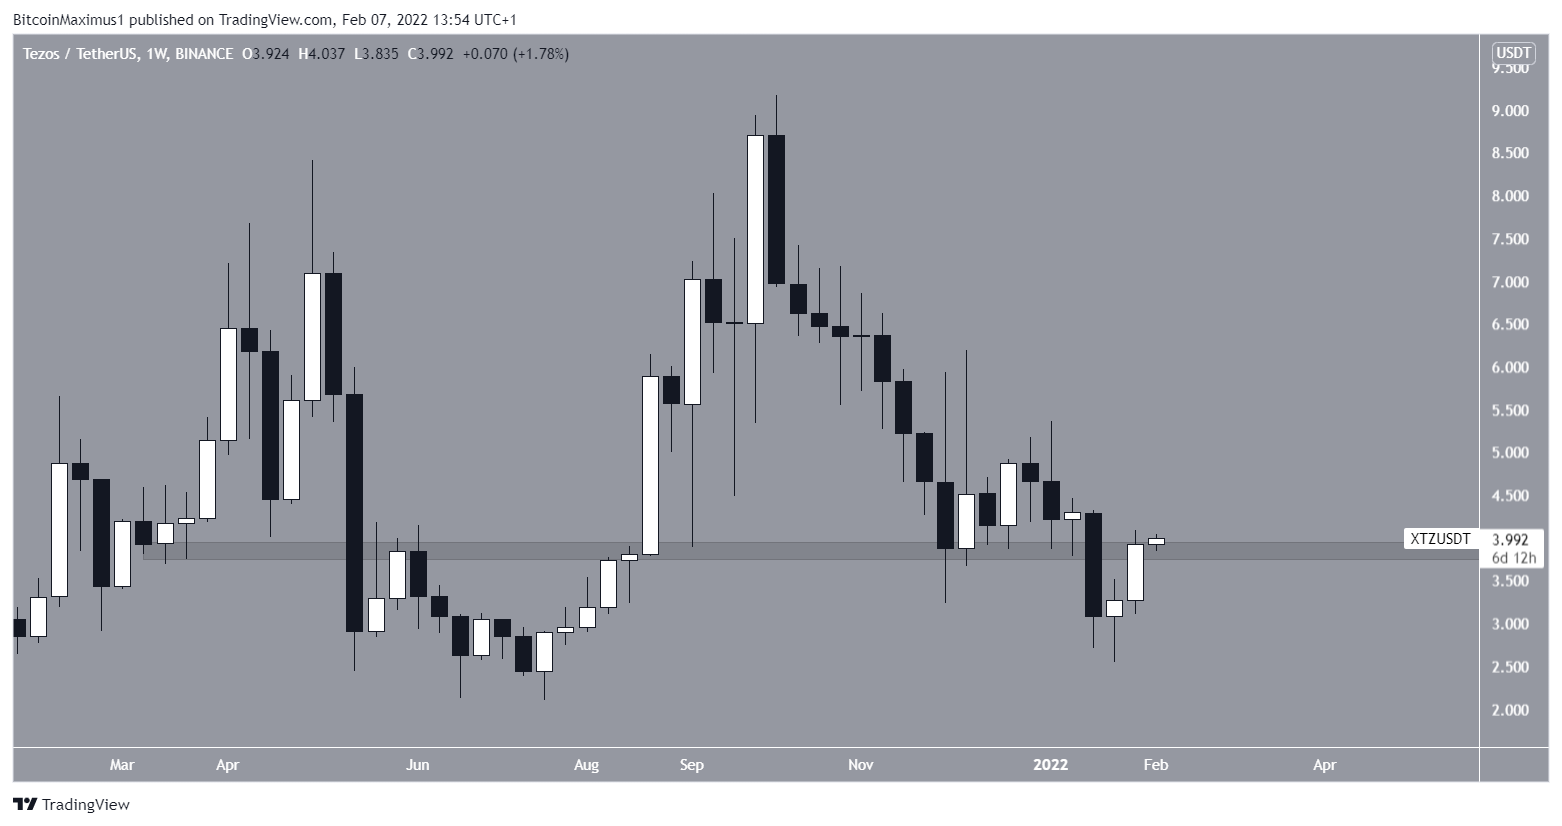
A look at the weekly chart for XTZ reiterates the importance of the $3.90 horizontal area, since it has intermittently acted as both support and resistance since March 2021.
Therefore, its reclaim would be a strong sign that the bullish trend will continue.
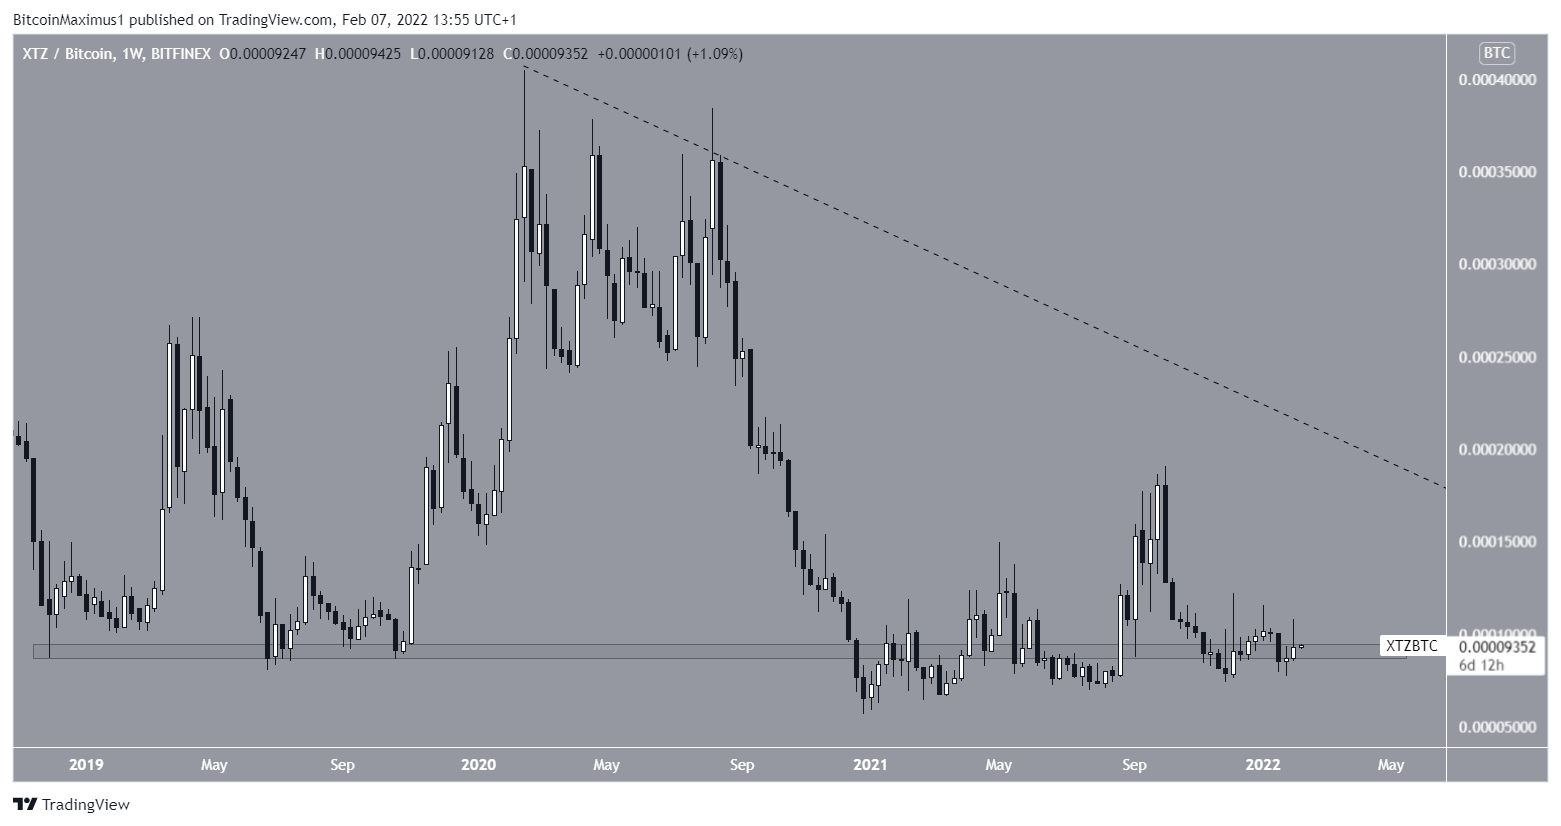
XTZ / BTC
The XTZ/BTC chart shows a similar movement, with the exception being that the token is still following a descending resistance line.
After initially falling below the 9000 satoshi area, XTZ has reclaimed it and is in the process of validating it as support. If it is successful in doing so, it would be a strong sign that a bullish reversal is transpiring.
For BeInCrypto’s latest Bitcoin (BTC) analysis, click here
Trusted
Disclaimer
In line with the Trust Project guidelines, this price analysis article is for informational purposes only and should not be considered financial or investment advice. BeInCrypto is committed to accurate, unbiased reporting, but market conditions are subject to change without notice. Always conduct your own research and consult with a professional before making any financial decisions. Please note that our Terms and Conditions, Privacy Policy, and Disclaimers have been updated.
