

Dogecoin (DOGE) has been showing bullish signs over the past five days and technical indicators suggest it could start to move up towards a descending resistance line.
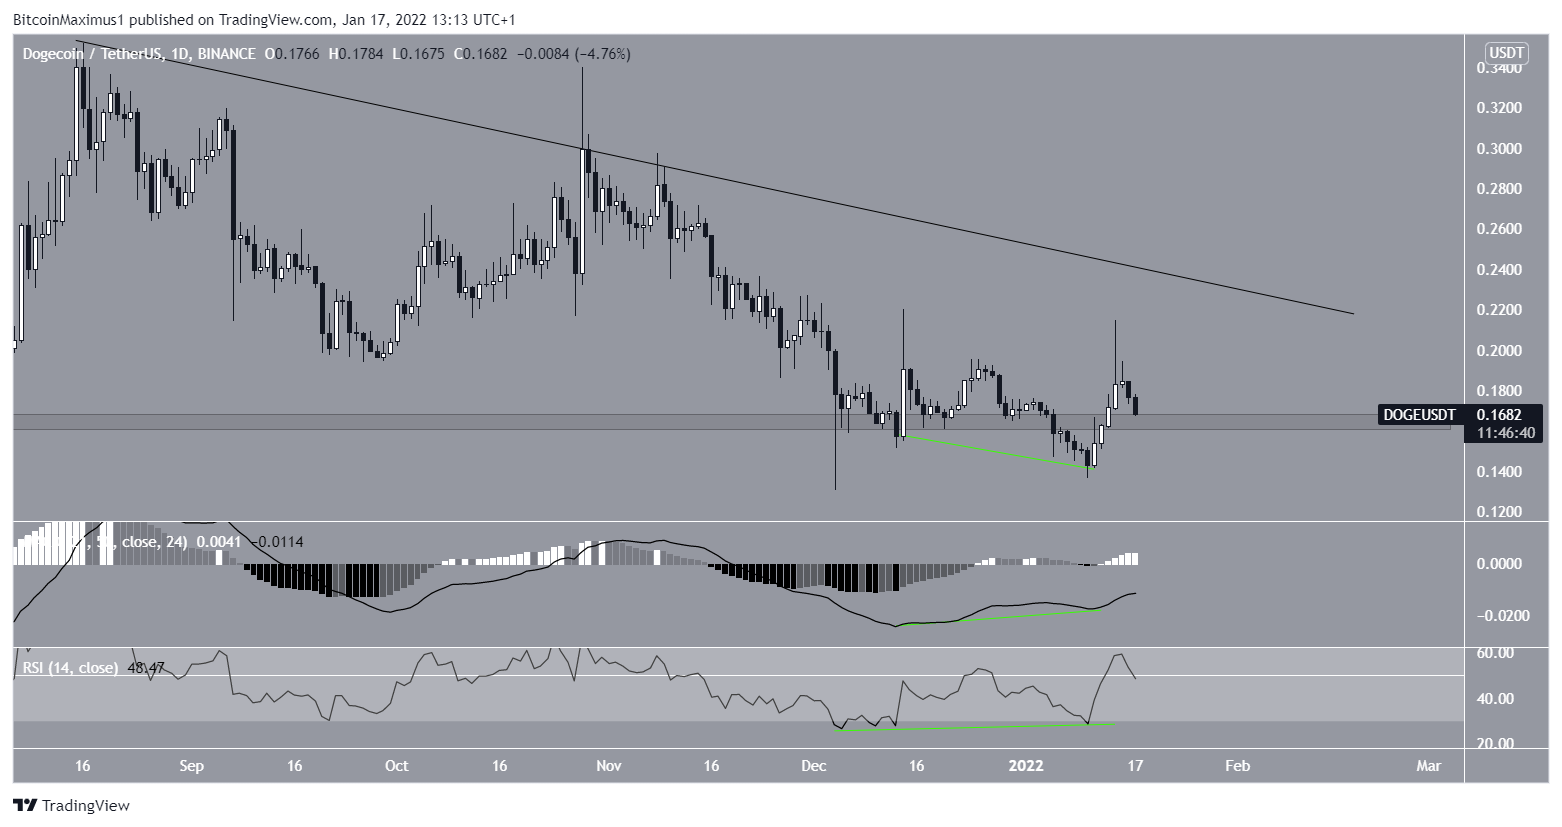
Dogecoin (DOGE) had been trading above the $0.165 horizontal support area since the beginning of May. On Jan 5, DOGE appeared to have broken down from this level for the first time in 257 days.
However, it reclaimed the area two days later and is currently in the process of validating it as support. In addition to this, DOGE is still trading underneath a descending resistance line that has been in place since August 2021.

Future movement
Technical indicators support a move to the upside in order to test the descending resistance line once again.
This is especially visible by the bullish divergences that have developed in both the MACD and RSI (green lines). This is a bullish signal that very often precedes price rallies.
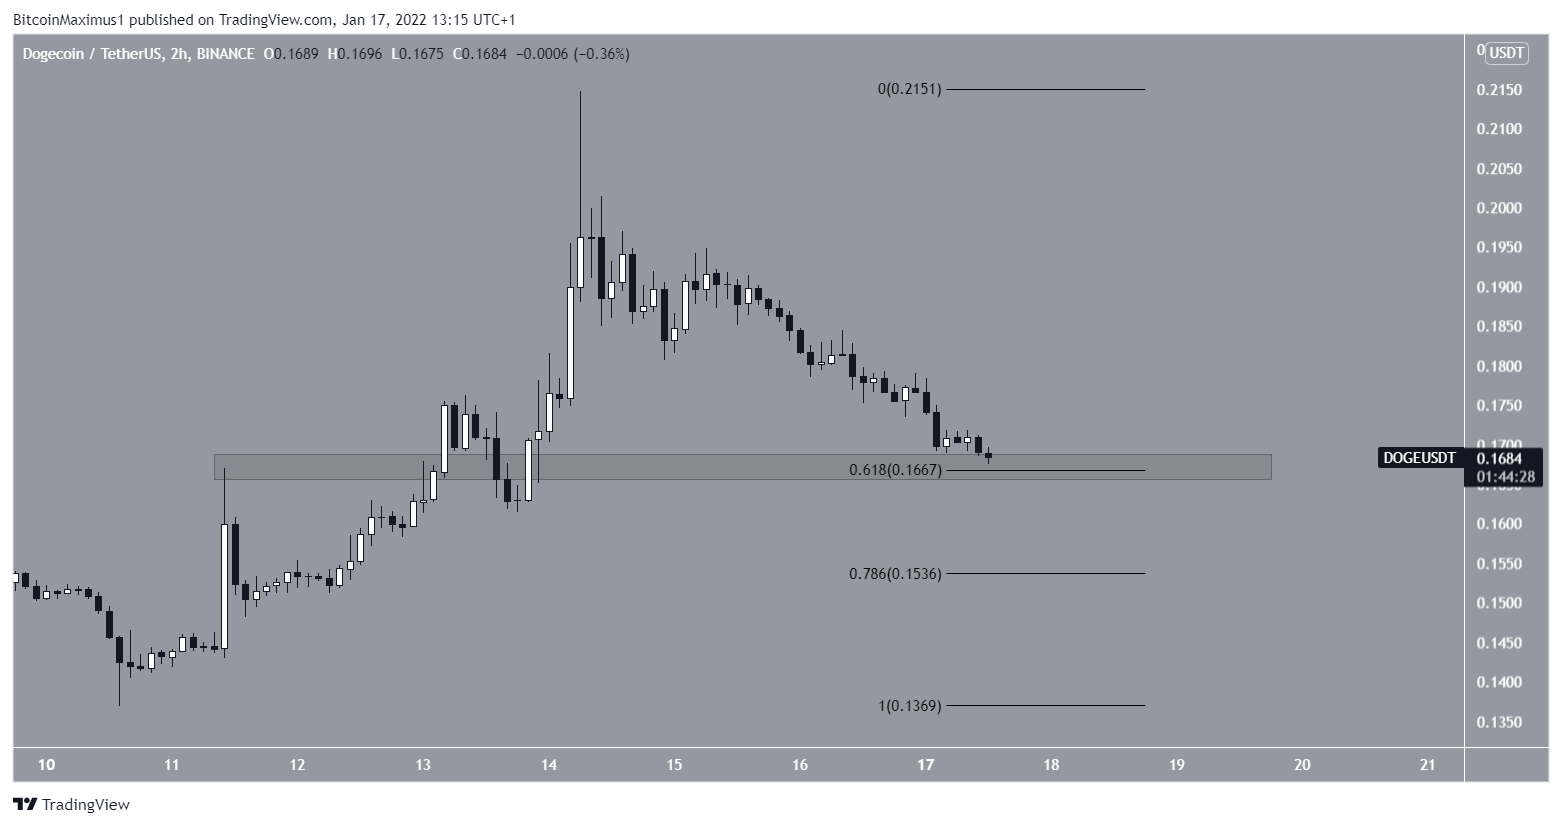
In order for the upward movement to continue, it’s crucial that DOGE creates a higher low.
The most likely area for this to occur is between $0.15-$0.166. This target range is the 0.618-0.786 Fib retracement support level. The latter is also a horizontal support area, increasing its significance.
Doge wave count
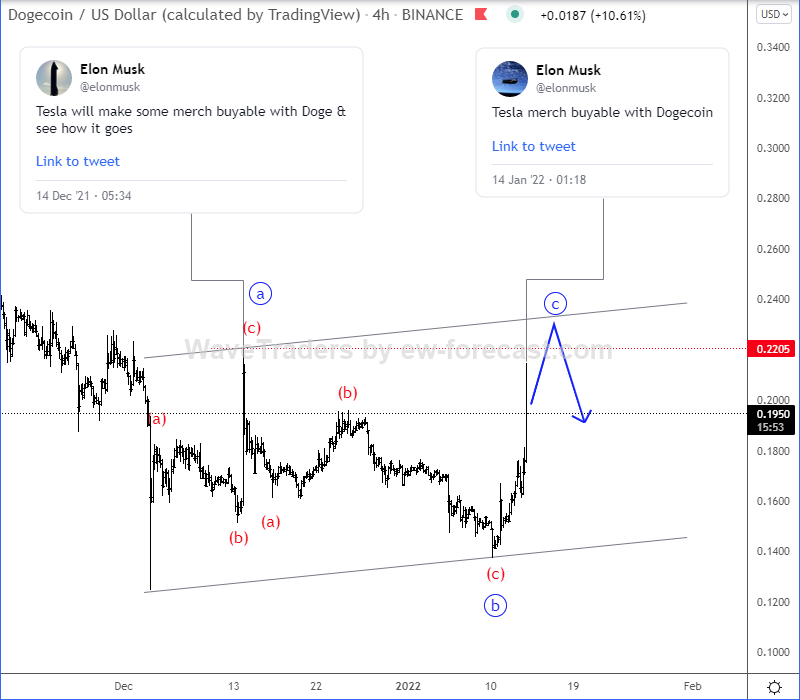
Technical analyst @ewforecast tweeted a DOGE chart, stating that it has likely completed its corrective trading phase.
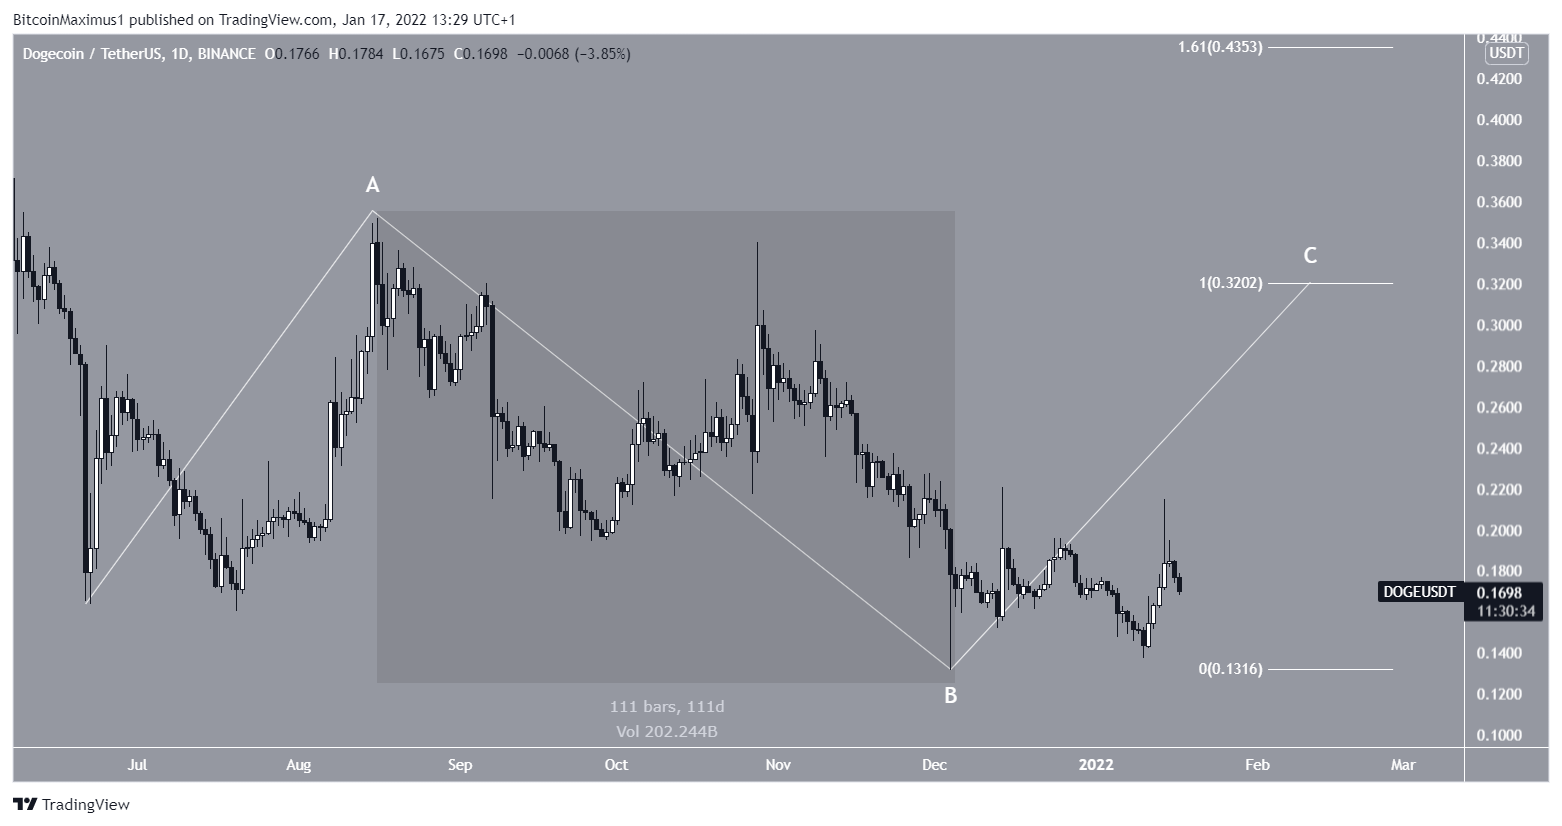
While this could be true in the short term, the entire movement since July looks like a large corrective structure.
The main reason for this is the constant overlap during the decrease that happened between August and December 2021 (highlighted).
If correct, DOGE looks to be currently in the C wave of this A-B-C corrective structure.
Giving waves A:C a 1:1 ratio would lead to a high of $0.32 for the top of a C wave.
For BeInCrypto’s latest Bitcoin (BTC) analysis, click here.
Trusted
Disclaimer
In line with the Trust Project guidelines, this price analysis article is for informational purposes only and should not be considered financial or investment advice. BeInCrypto is committed to accurate, unbiased reporting, but market conditions are subject to change without notice. Always conduct your own research and consult with a professional before making any financial decisions. Please note that our Terms and Conditions, Privacy Policy, and Disclaimers have been updated.
