

Bitcoin (BTC) has returned to its previous support area and could be in the beginning stages of creating a bullish short-term pattern.
The daily chart shows that BTC is still hovering above the $56,500 horizontal support area. This is the 0.382 Fib retracement support level and a horizontal support area. BTC bounced at this area on Nov 19 and has now returned to it.
However, technical indicators in the daily time frame are bearish.
The MACD, which is created by a short and long-term moving average (MA), is decreasing and is nearly negative. This means that the short-term MA is moving slower than the long-term one.
The RSI, which is a momentum indicator, has fallen below 50. RSI movements below the 50-line are often associated with bearish trends. In order for the upward movement to resume, it’s imperative that the RSI reclaims this line.
If a breakdown were to occur, the next support for BTC would be found at $53,250. This is the 0.5 Fib retracement support level.

Possible double bottom
The six-hour chart shows that a potential double bottom is developing. This is a bullish pattern that often leads to reversals.
Furthermore, it has been combined with a bullish divergence in both the RSI and MACD. This is an occurrence when a price decrease is not accompanied by a decrease in technical indicators and often leads to bullish reversals.
If BTC reverses, there would be strong resistance at $60,730. This is the 0.382 Fib retracement resistance level and a horizontal resistance area. Furthermore, it coincides with a potential descending resistance line that’s been in place since the all-time high.

Wave count
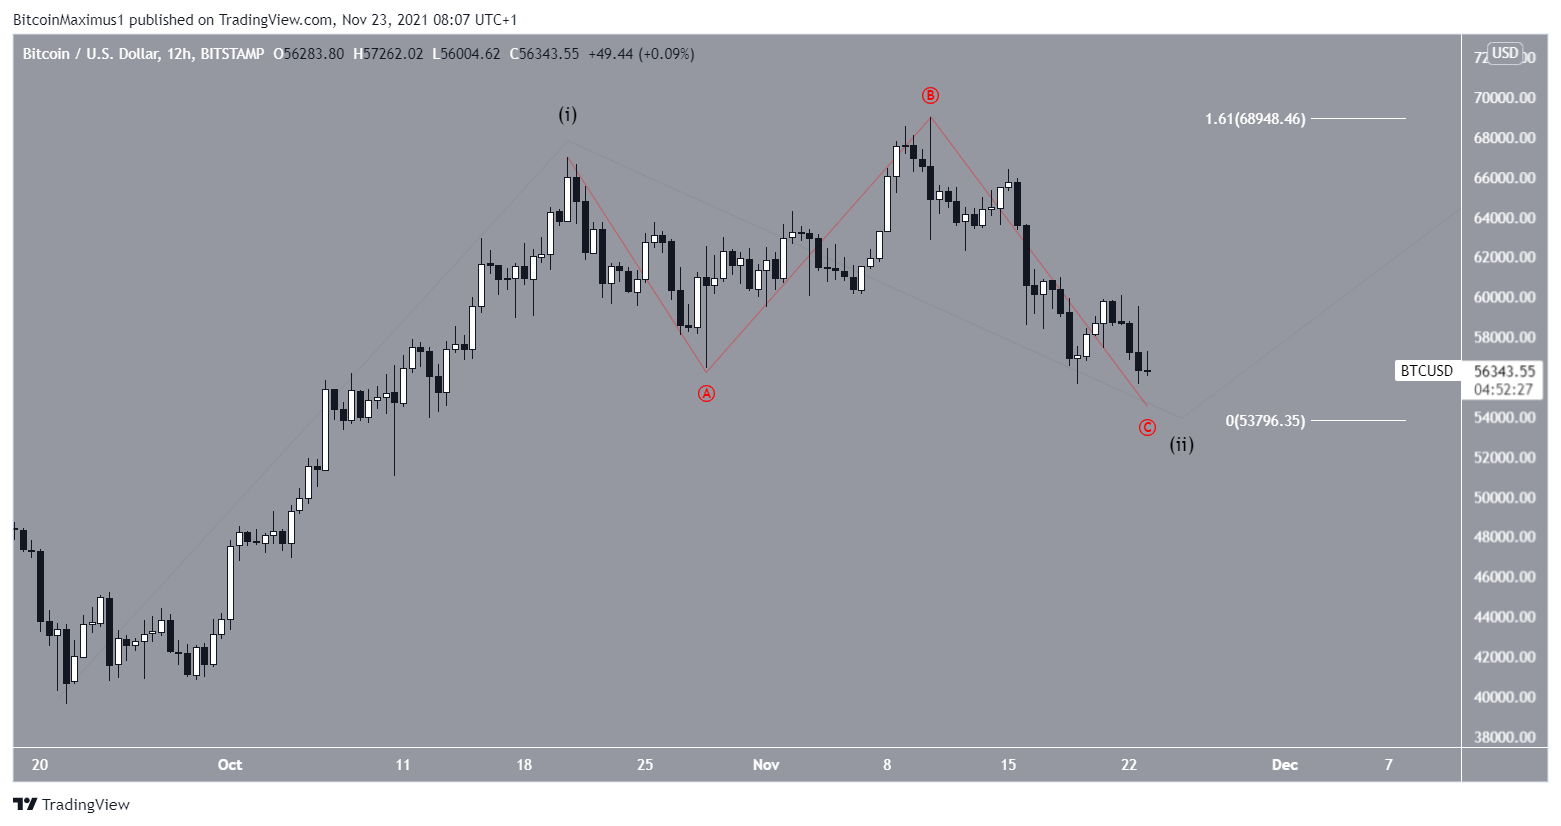
The BTC wave count suggests that the decrease since Oct 20 is an A-B-C corrective structure (red), that completes a longer-term wave two (black).
Since waves A:C have nearly a 1:1.61 ratio, it’s likely that the short-term bottom is close or has been reached.
The long-term wave count is bullish, showing that that BTC is inside a large 1-2/1-2 wave formation.
The alternate short-term count is more bearish in the medium-term, but it still suggests that an upward movement towards $62,400-$64,000 could transpire before another drop.
For BeInCrypto’s previous Bitcoin (BTC) analysis, click here.
Trusted
Disclaimer
In line with the Trust Project guidelines, this price analysis article is for informational purposes only and should not be considered financial or investment advice. BeInCrypto is committed to accurate, unbiased reporting, but market conditions are subject to change without notice. Always conduct your own research and consult with a professional before making any financial decisions. Please note that our Terms and Conditions, Privacy Policy, and Disclaimers have been updated.
