
Serum (SRM) has been moving downwards since Sept 11 but is showing signs that it could potentially reverse its trend and begin to move upwards.
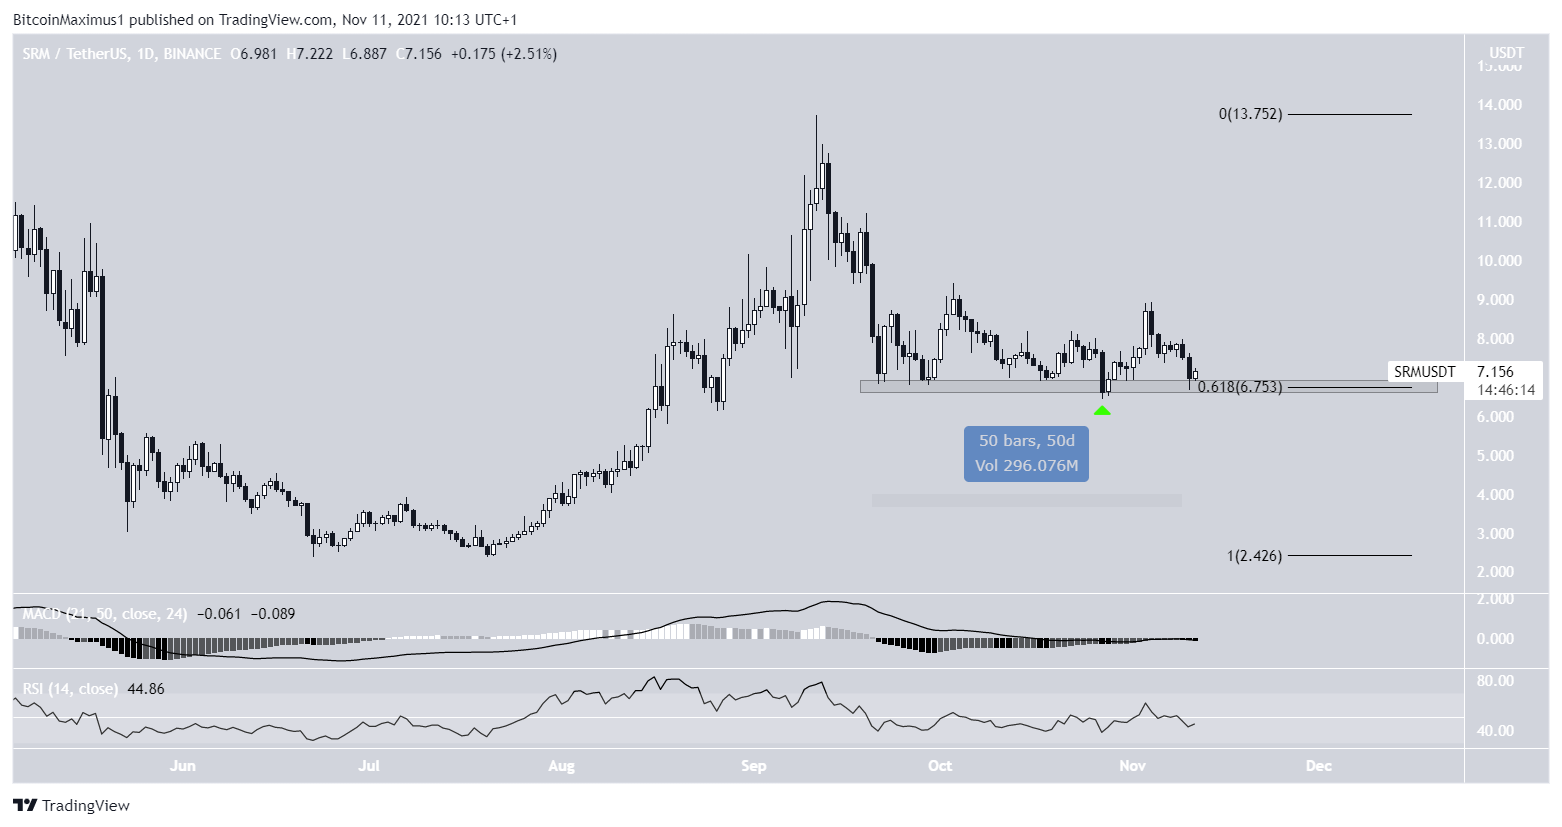
Over the past 50 days, SRM has been consolidating just above the $6.73 support area. This is the 0.618 Fib retracement support level and a horizontal support area.
Recently, it bounced at the level on Oct 27 and initiated the current short-term upward movement. The bounce further solidified the importance of the $6.73 area.
Technical indicators for SRM are close to turning bullish but have not yet done so.
The MACD, which is created by a short and long-term moving average (MA) has been moving upwards since the beginning of October and has nearly crossed into positive territory. If it does, it would mean that the short-term MA is moving at a faster rate than the long-term MA. This is a bullish sign that is symptomatic of bullish trends. The MACD was positive during the entire upward move between July and September.
The RSI, which is a momentum indicator, is right at the 50-line. A movement above this line would imply that momentum is bullish. However, unlike the MACD, the RSI has a slightly downward slope.
Short-term breakout
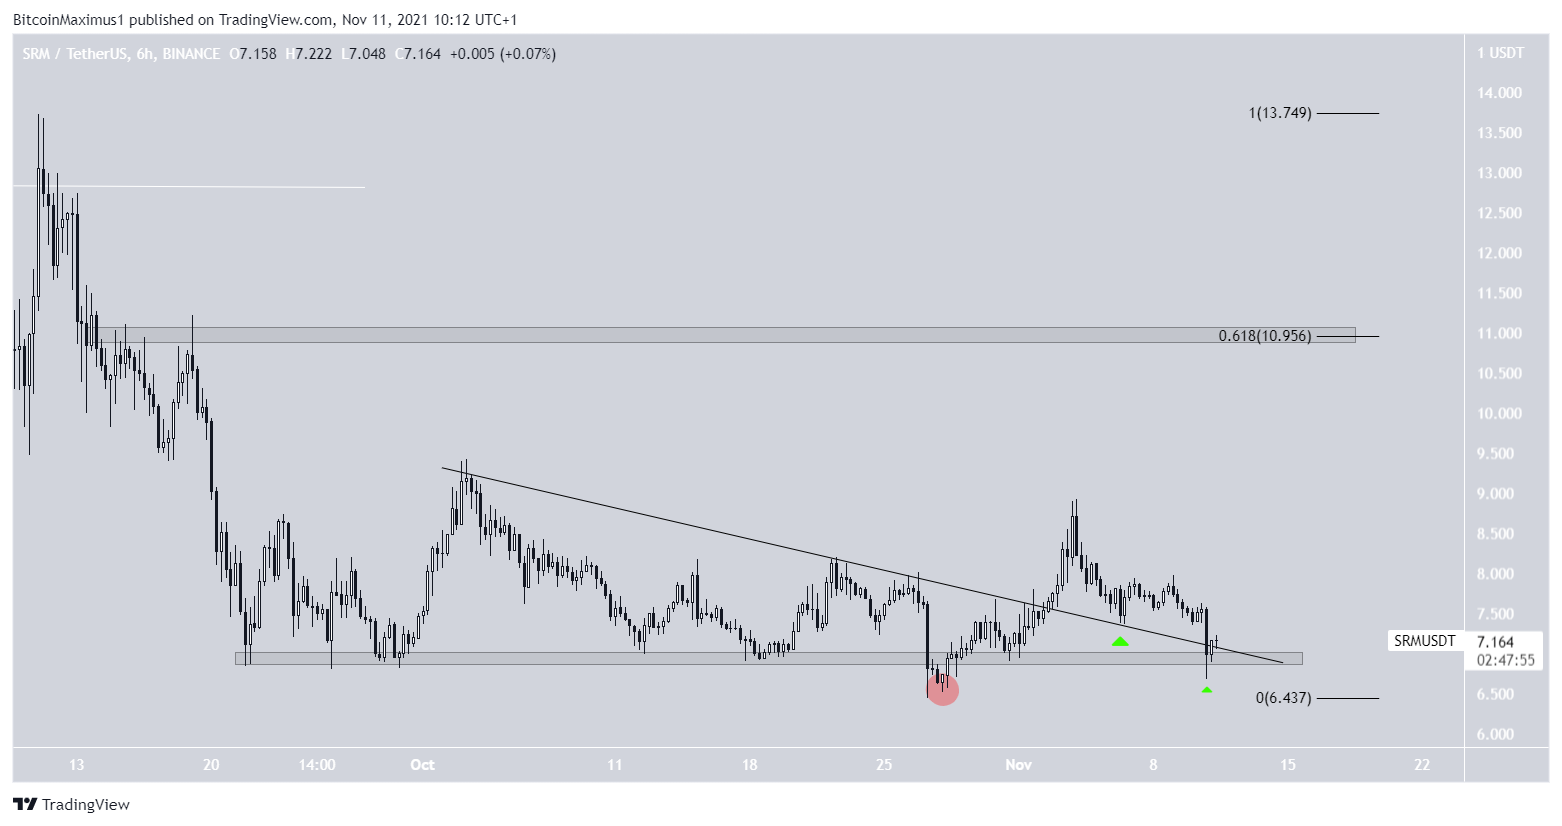
The six-hour chart shows that SRM has broken out from a descending resistance line and validated it as support after (green icon). This confirmed that the downward movement had come to an end.
Furthermore, the aforementioned bounce on Oct 27 becomes even more important, since prior to it, SRM had deviated (red circle) below the $6.73 support area. After the Nov 10 drop, it validated it as support once again.
Such deviations are often followed by significant movements in the other direction, which has been the case for SRM so far.
The next closest resistance area is at $10.97, created by the 0.618 Fib retracement resistance level and a horizontal resistance area.
SRM wave count
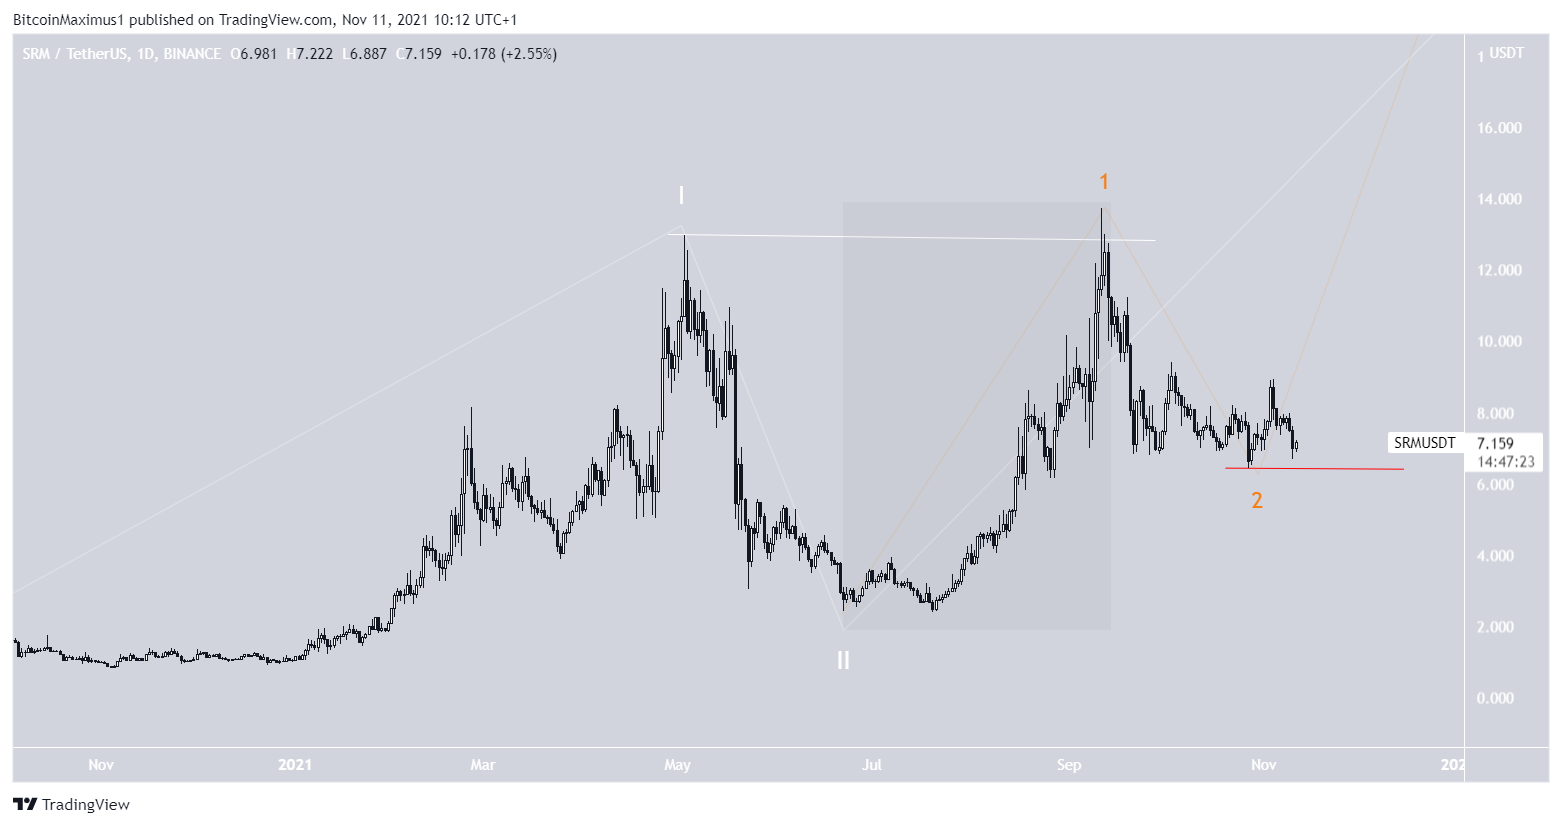
Cryptocurrency trader @TheTradingHubb outlined a SRM chart, showing that it has begun a massive 1-2/1-2 wave formation that could lead to prices above $20.

One of the possibilities for the wave count is indeed a 1-2/1-2 formation. This is a pattern in which a considerable upward move is followed up by another even more significant rally.
The main reason for this possibility is that the top of sub-wave one (orange) went slightly above the top of wave one (white). Furthermore, sub-wave one had a sharper slope (highlighted in black).
However, it still seems too early to determine if this is the correct count for SRM.
A decrease below the Oct 27 low of $6.43 (red line) would invalidate this particular count.
For BeInCrypto’s latest Bitcoin (BTC) analysis, click here.
Trusted
Disclaimer
In line with the Trust Project guidelines, this price analysis article is for informational purposes only and should not be considered financial or investment advice. BeInCrypto is committed to accurate, unbiased reporting, but market conditions are subject to change without notice. Always conduct your own research and consult with a professional before making any financial decisions. Please note that our Terms and Conditions, Privacy Policy, and Disclaimers have been updated.
