

Bitcoin (BTC) has potentially reached the local top of its upward movement and is now correcting towards support.
Bitcoin reached yet another new all-time high price of $69,000 on Nov 10. However, it fell almost immediately after, reaching a low of $65,982 the same day.
The drop was preceded by bearish divergences in both the RSI and the MACD. This often precedes bearish trend reversals. Furthermore, the decrease was combined with a noticeable spike in volume (red icon), which was the highest since Oct 27.
If a trend reversal were to occur, the closest support areas would be found at $57,750 and between $53,770-$54,250.
The former is the short-term 0.382 Fib retracement support level (white). The latter is an area created by the short-term 0.5 and the long-term 0.382 (black) Fib retracement support levels.

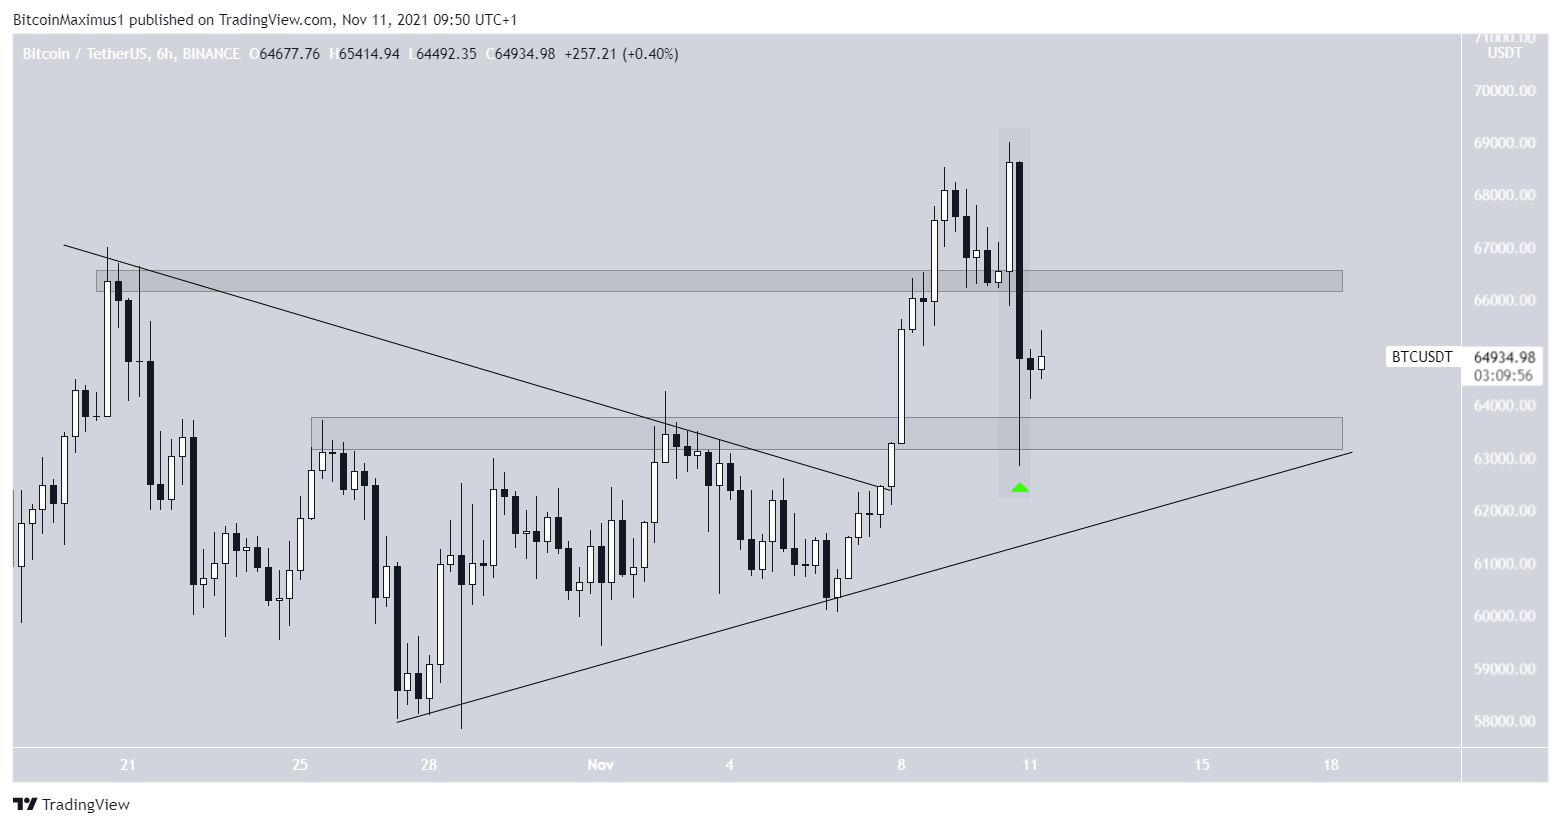
Short-term support
The six-hour chart shows a massive bearish engulfing candlestick caused by the drop. This is a type of bearish candlestick in which the previous bull candle is completely engulfed by a larger candlestick in the other direction. It further supports the possibility of a continued drop.
In addition to this, BTC fell right through the $66,300 area, which was expected to act as support. It reached the $63,500 support area before bouncing (green icon). The area will soon coincide with an ascending support line that’s been in place since Oct 25.
So, there is strong support created by the $63,500 support area and the previous ascending support line.
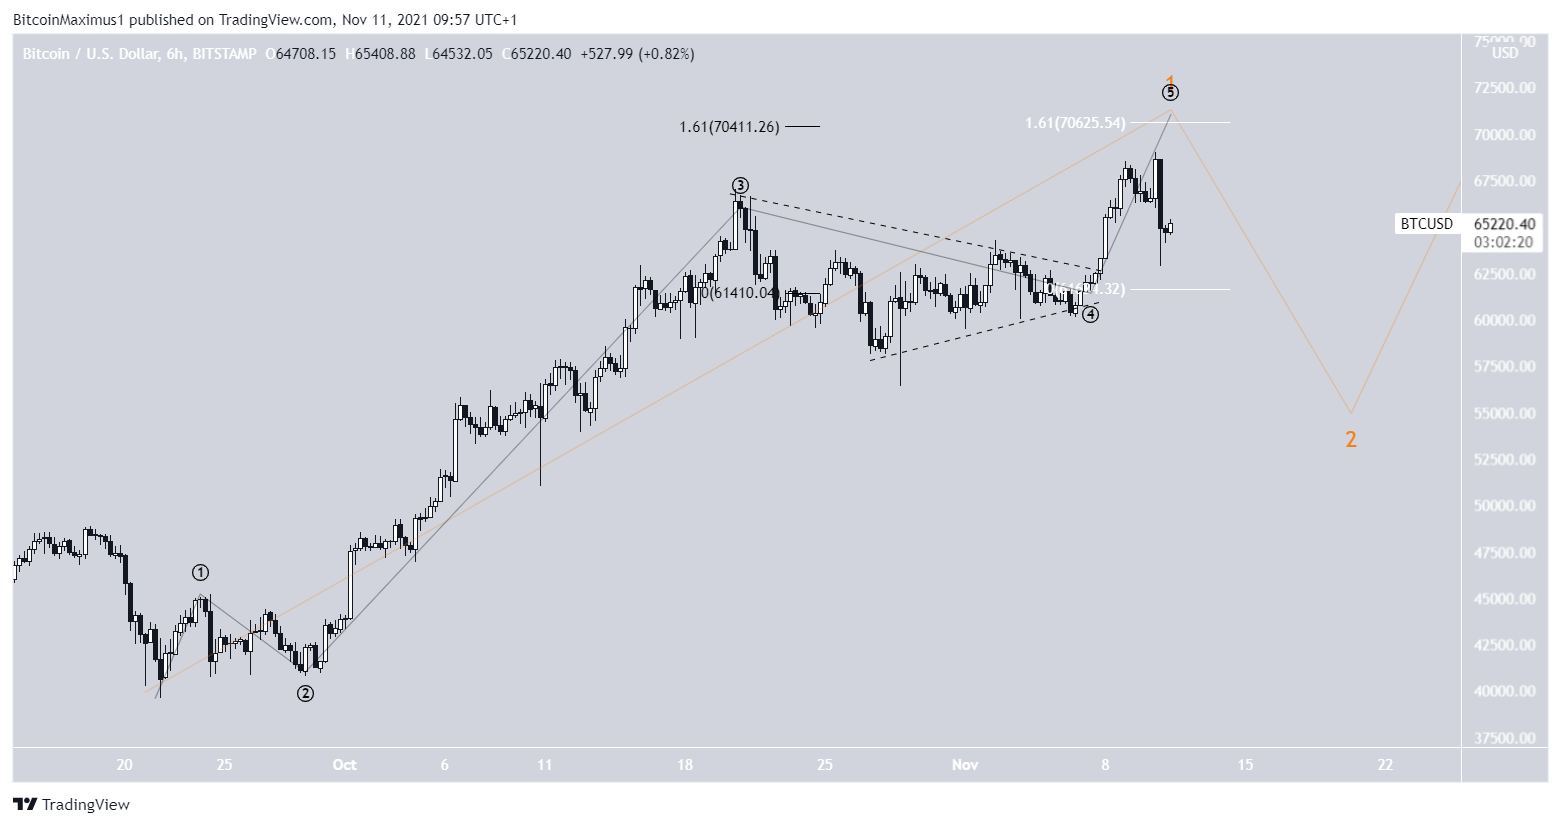
Wave count
The wave count also supports the possibility that BTC has reached a local top. It shows that it has potentially completed wave one (orange) of an upward move that has been in place since Sept 21.
The sub-wave count is shown in black and suggests that BTC might have completed wave five.
The high was reached closed to the $70,500 target given by using an external Fib retracement (black) and Fib projection (white).
If correct, BTC could decrease towards the support levels previously outlined, as part of wave two.
The alternate wave count would suggest that BTC has been in wave two since Oct 19. However, it would still indicate that a decrease towards at least $61,000 would occur.
This would touch the support line of the parallel channel. Furthermore, an extension on sub-wave c (black) would take it all the way to $54,300, aligning with the long-term support and readings from the previous count.

For BeInCrypto’s previous Bitcoin (BTC) analysis, click here.
Trusted
Disclaimer
In line with the Trust Project guidelines, this price analysis article is for informational purposes only and should not be considered financial or investment advice. BeInCrypto is committed to accurate, unbiased reporting, but market conditions are subject to change without notice. Always conduct your own research and consult with a professional before making any financial decisions. Please note that our Terms and Conditions, Privacy Policy, and Disclaimers have been updated.
