

Serum (SRM) reached a new all-time high price on April 11, but decreased shortly afterwards.
Despite the ongoing drop, SRM is expected to find support and reverse its short-term bearish trend. Afterwards, a new all-time high price is expected.
SRM all-time high and double top
On Feb. 25, SRM reached a then all-time high (ATH) price of $8.14. After a considerable drop, it managed to break out from a descending resistance line.
This move led to a new all-time high of $8.20 being reached on April 11. However, the upward move was not sustained and the token created a double top pattern.
Since then, SRM has been moving downwards.
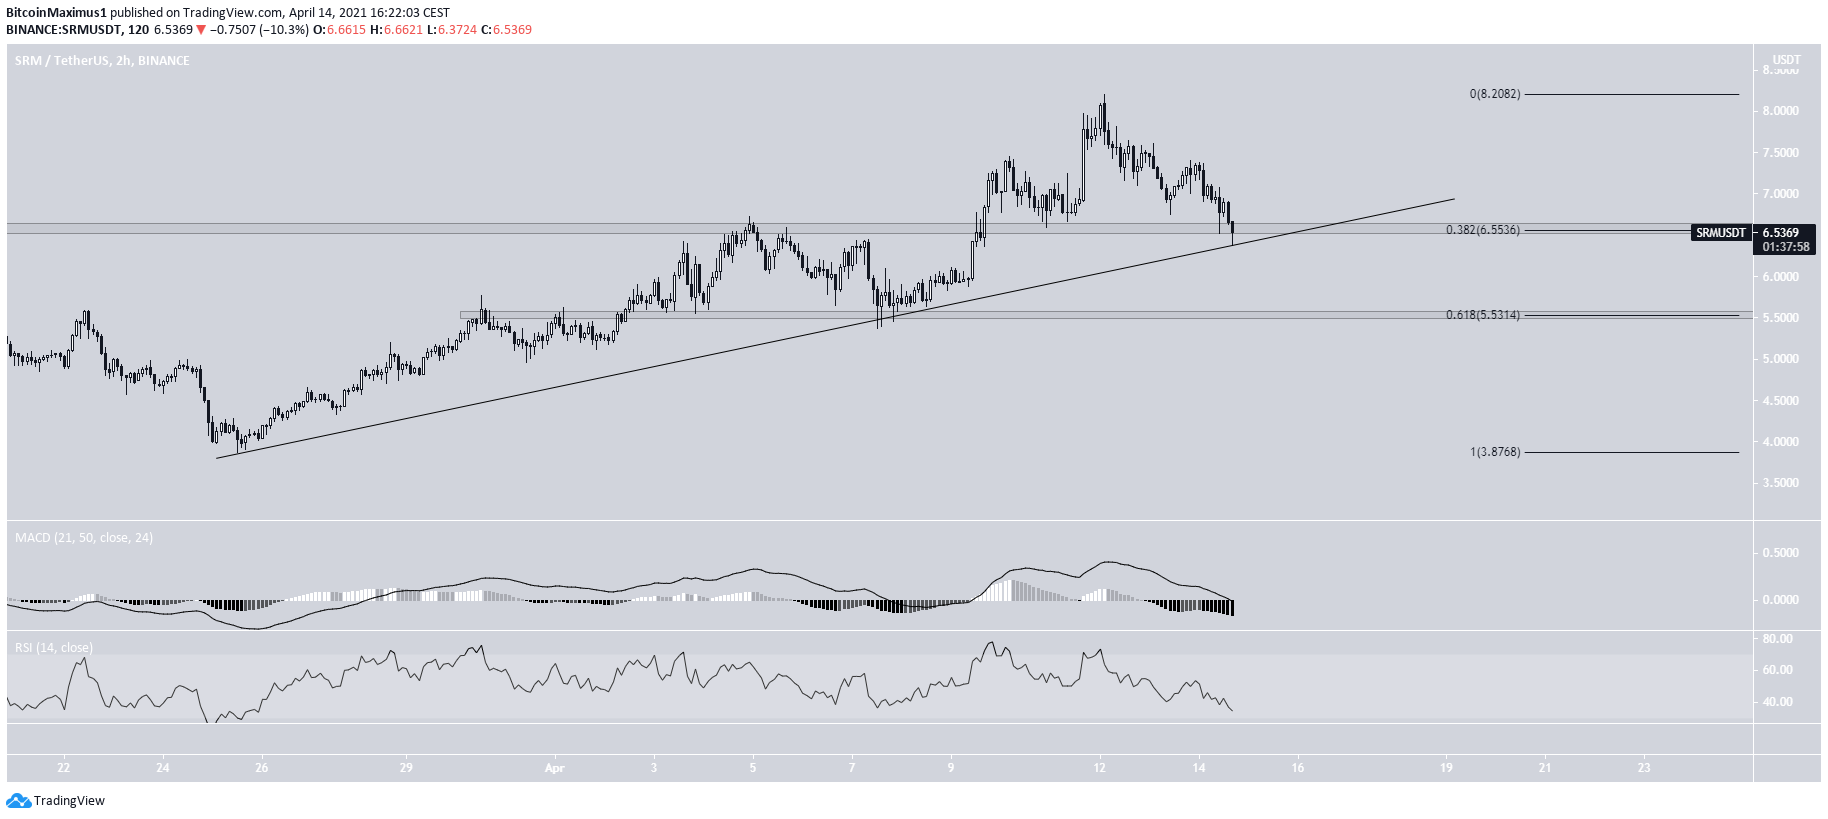
Currently, it has reached the $6.54 support area. This is both the 0.382 Fib retracement level and a horizontal resistance area. The next support levels below it are found at $6.05 and $5.55.

Short-term movement
Despite the lack of bullish reversal signs, the $6.55 level remains the most likely out of the three to initiate a reversal.
This is because it provides a confluence of support level:
- Fib support level
- Horizontal support level.
- Diagonal support level (ascending support line).
If SRM breaks down, the next most likely reversal area would be found at $5.55, which is both the 0.618 Fib retracement and a horizontal support area.
Wave count for SRM
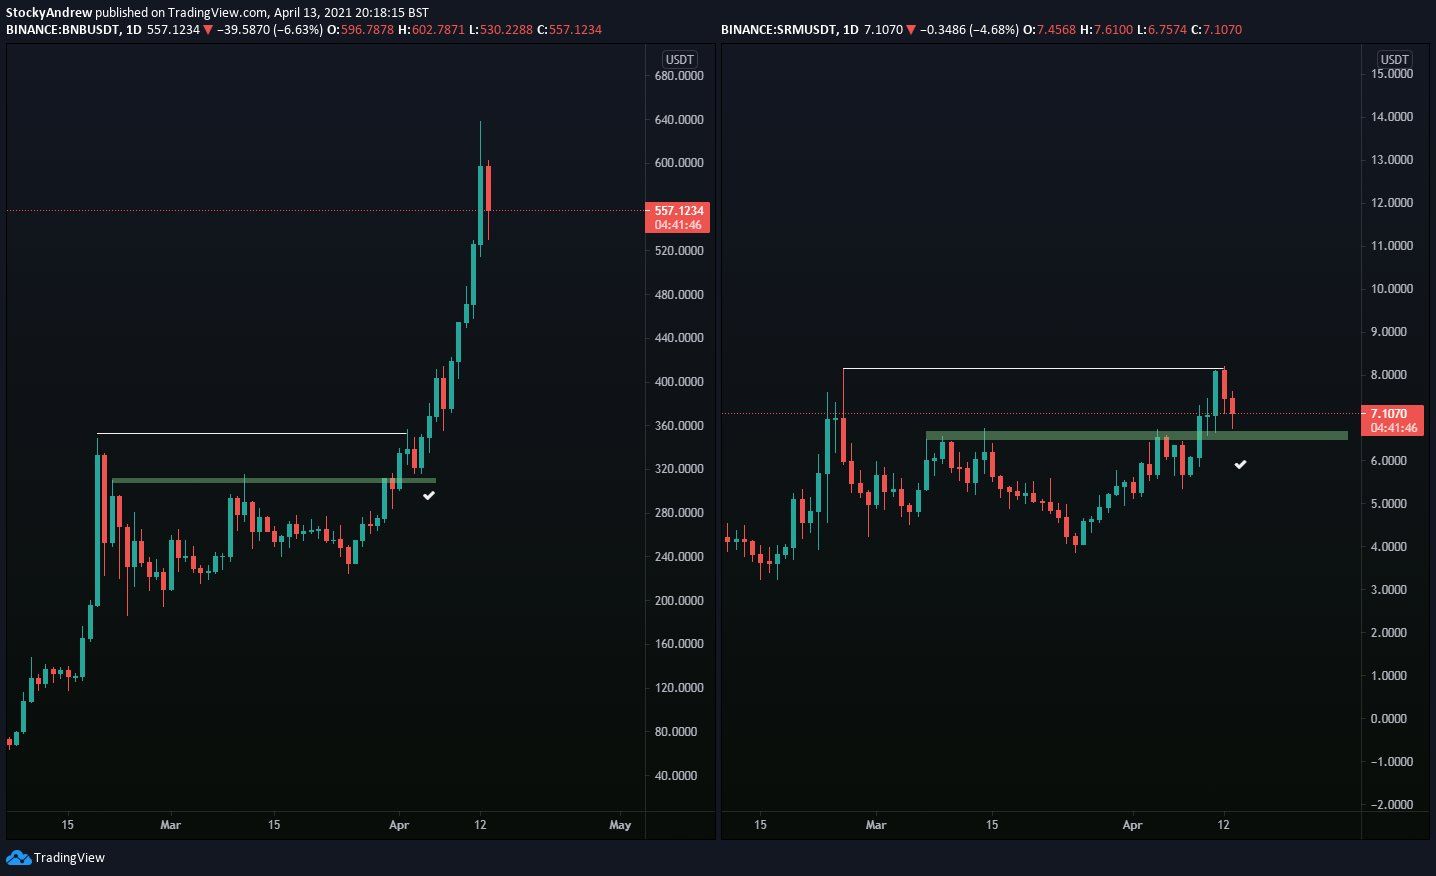
Cryptocurrency trader @ACXtrades outlined a SRM chart, stating that it has the exact same setup as BNB had prior to taking off.
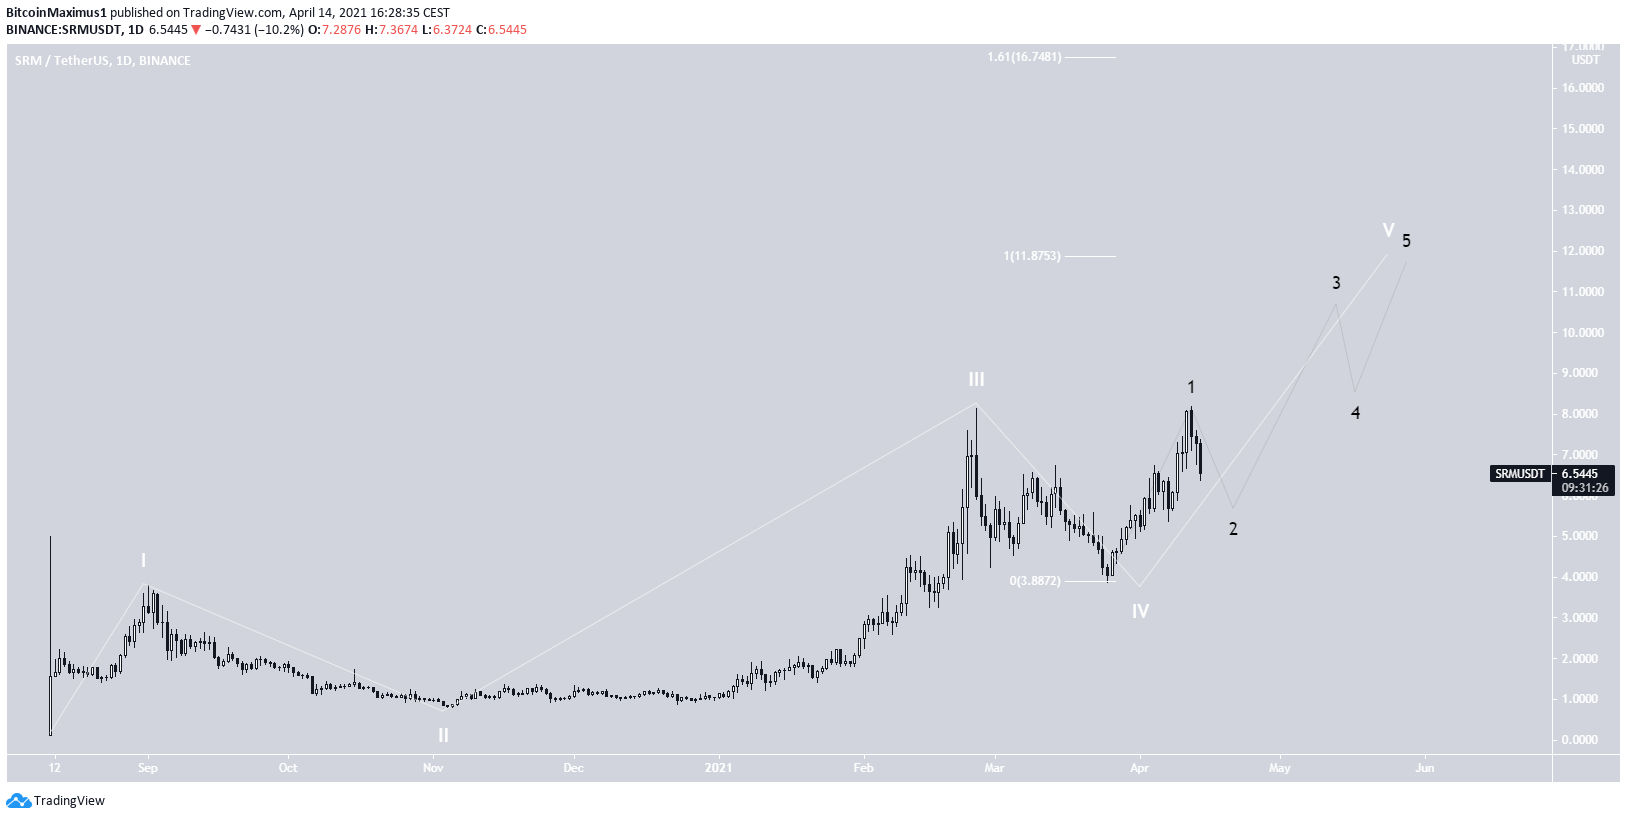
The wave count suggests that SRM is in wave five of a long-term bullish impulse (white). The sub-wave count is given in black.
A potential target for the top of the upward movement is located at $11.90. This is found by using a Fib projection on waves 1-3.
If wave five extends, the next most likely target would be found at $16.74. Currently, it cannot be determined whether wave five will extend or not.
Conclusion
To conclude, SRM is expected to find support at one of the short-term support levels outlined. Afterwards, an upward move that takes it to a new all-time high price is expected.
For BeInCrypto’s latest bitcoin (BTC) analysis, click here.
Trusted
Disclaimer
In line with the Trust Project guidelines, this price analysis article is for informational purposes only and should not be considered financial or investment advice. BeInCrypto is committed to accurate, unbiased reporting, but market conditions are subject to change without notice. Always conduct your own research and consult with a professional before making any financial decisions. Please note that our Terms and Conditions, Privacy Policy, and Disclaimers have been updated.
