

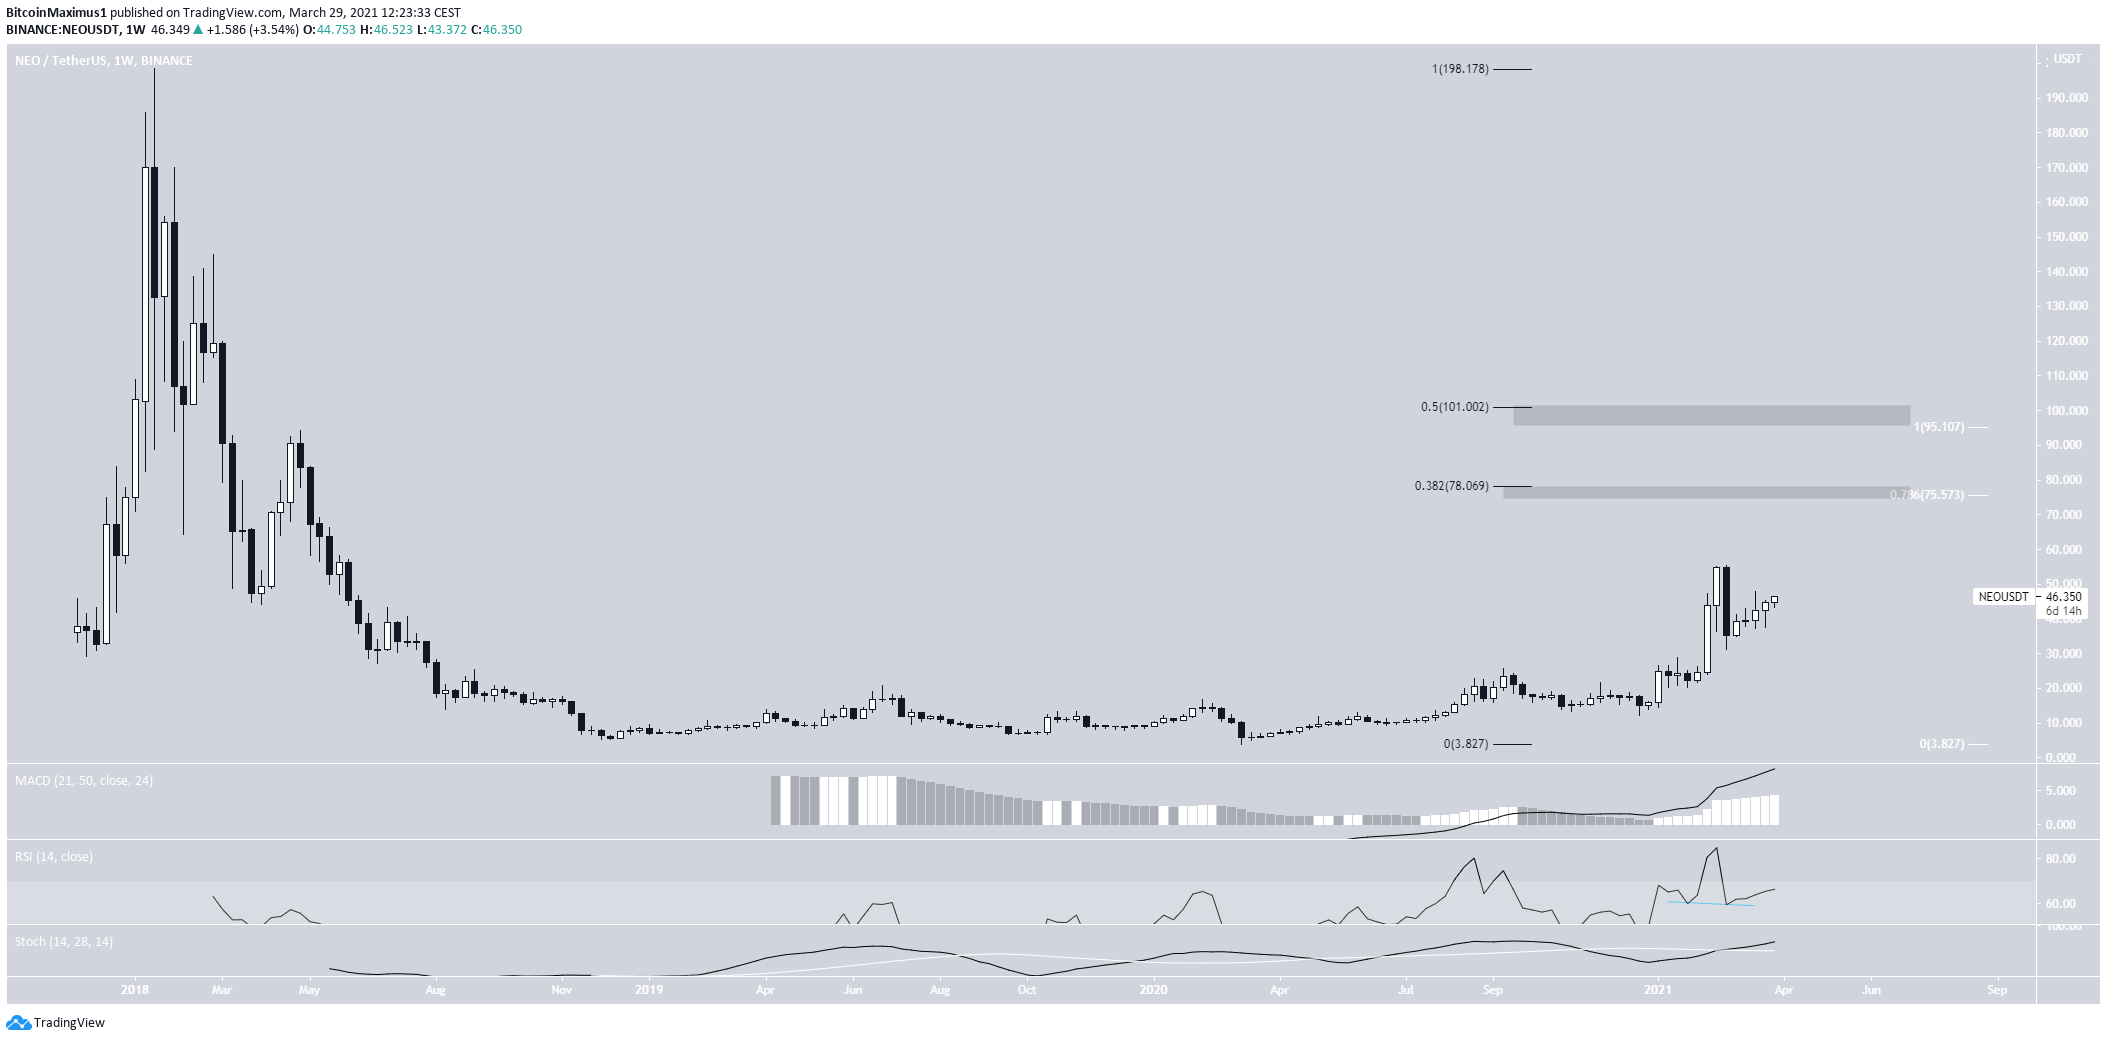
Neo (NEO) seems to be in a bullish impulse and is expected to increase towards its long-term resistance levels.
Binance Coin (BNB) is trading inside a symmetrical triangle, but the next move’s direction cannot be confidently determined.
Litecoin (LTC) is also trading inside a symmetrical triangle, but a breakout is expected.
Neo (NEO)
NEO reached a high of $55.44 on Feb. 22 but decreased immediately afterward, creating a weekly bearish engulfing candlestick.
However, it has been gradually moving upwards since.
Technical indicators in the weekly time-frame are bullish. The MACD & Stochastic oscillator are moving upwards, the latter having made a bullish cross.
The RSI has generated hidden bullish divergence and is moving upwards.
The next closest resistance areas are found between $76-$78 and $95-101. The levels are located from a long-term Fib retracement (black) confluence and a short-term one (white).
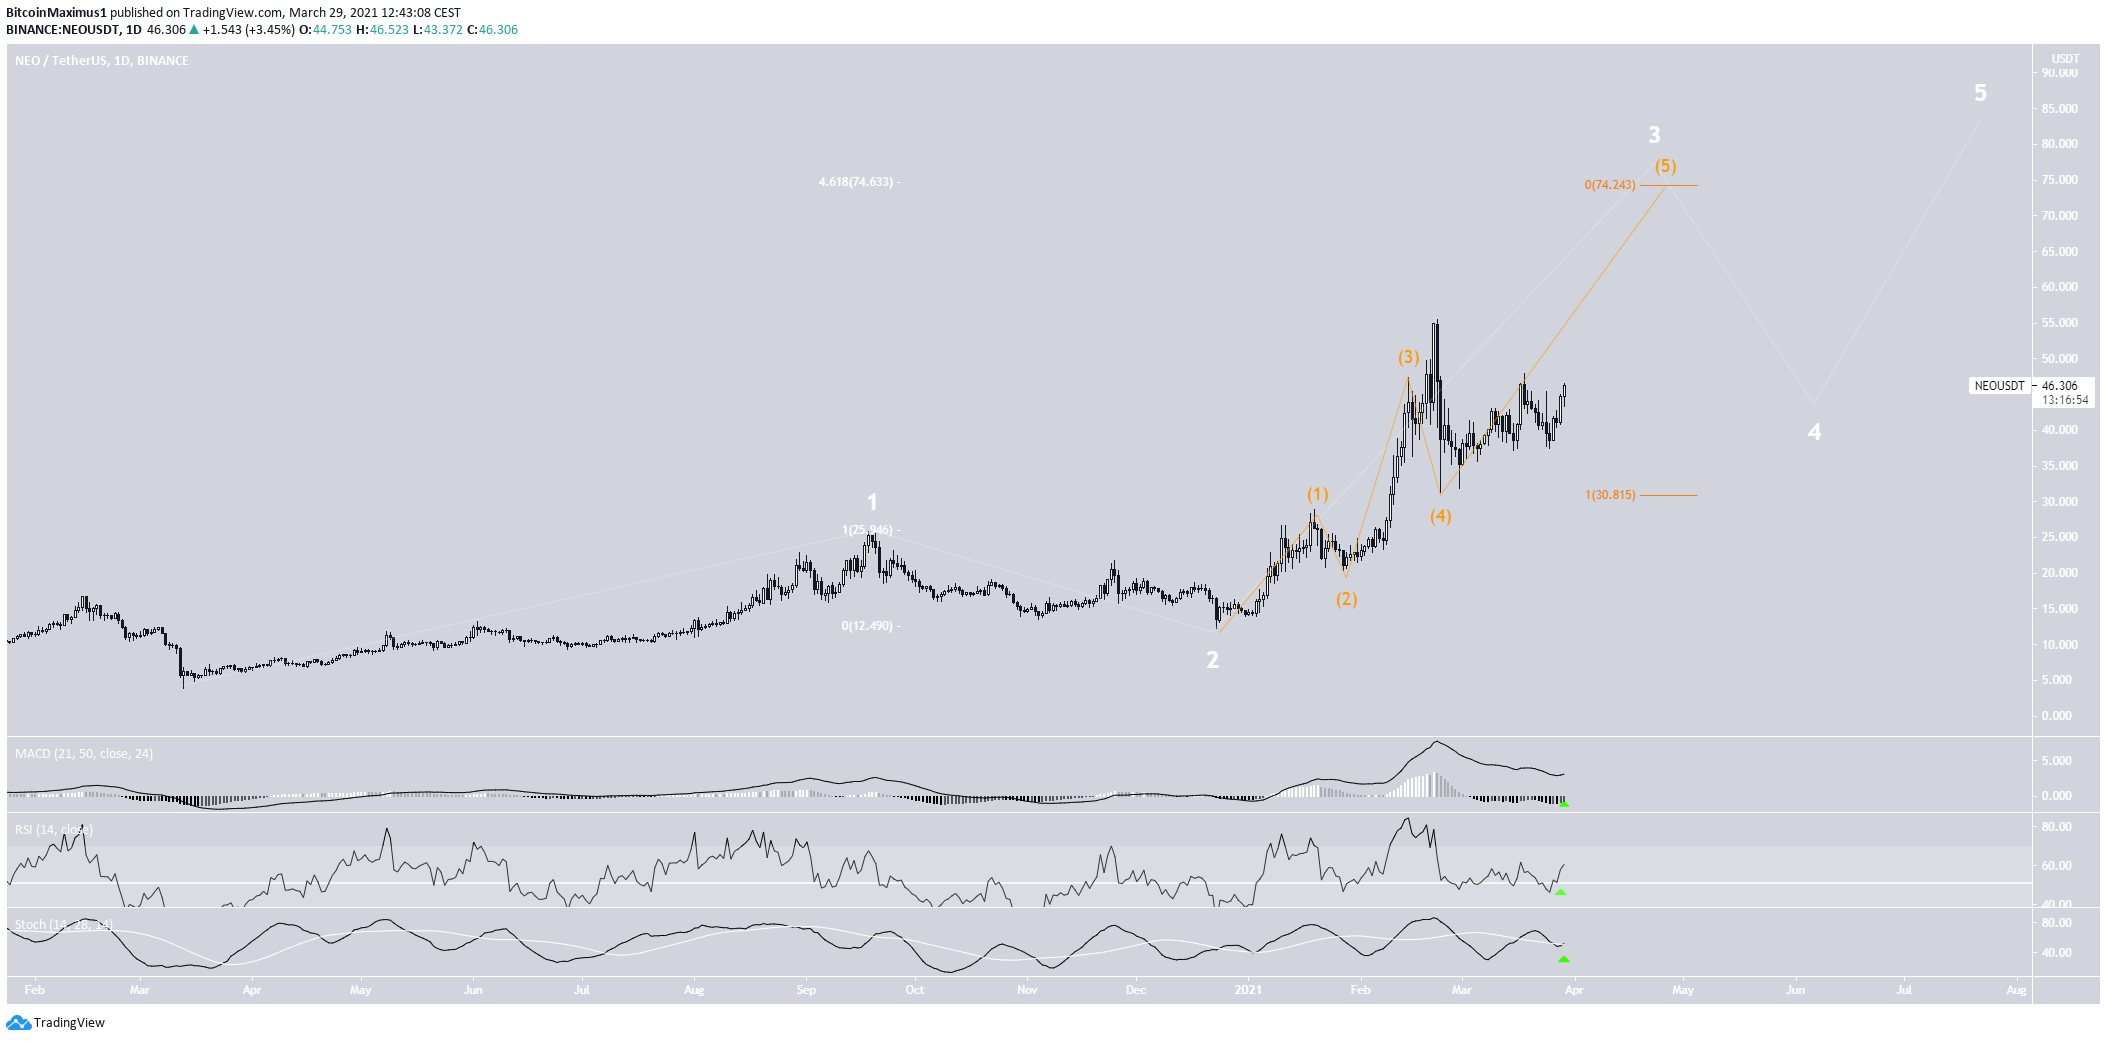
Similar to the weekly time-frame, technical indicators in the daily time-frame are bullish. The MACD has given a bullish reversal signal, the RSI has crossed above 50, and the Stochastic oscillator has made a bullish cross.
Also, it does seem that NEO is in sub-wave five (orange) of an extended wave three (white).
A potential target for the top of this movement is $74, lining up with the weekly chart’s resistance.
Highlights
- NEO is facing resistance at $76-78 and $95-101.
- It is likely in an extended bullish wave three.
Litecoin (LTC)
On Feb. 14, LTC reached a high of $255.71 before decreasing. However, the drop only served to validate the $175 area as support.
LTC faces resistance at $246, the 0.618 Fib retracement level of the entire downward movement, measuring from the all-time high price.
If it manages to break out, LTC would likely find the next resistance near the all-time high of $385.
Similar to NEO, the RSI has been generating hidden bullish divergence.
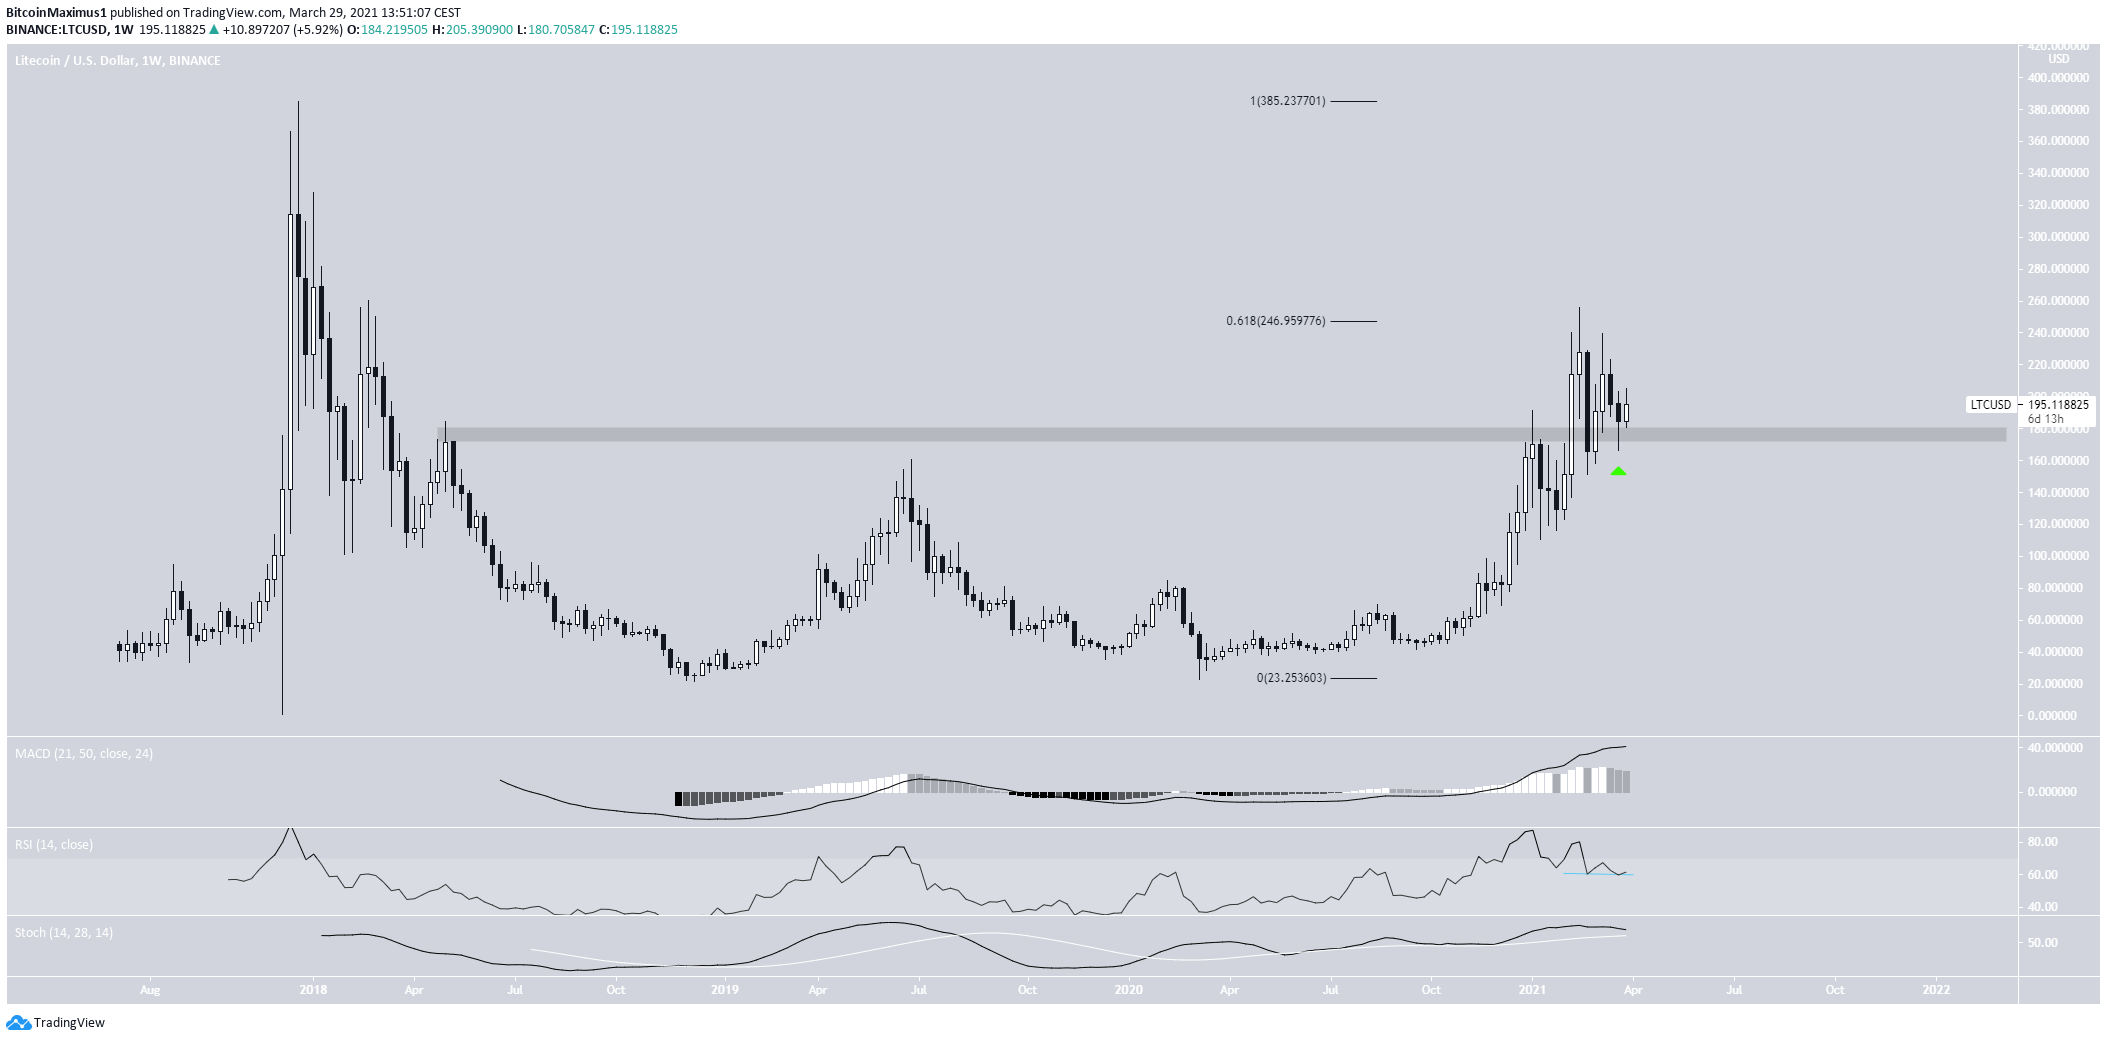
Indicators in the daily time-frame are relatively neutral.
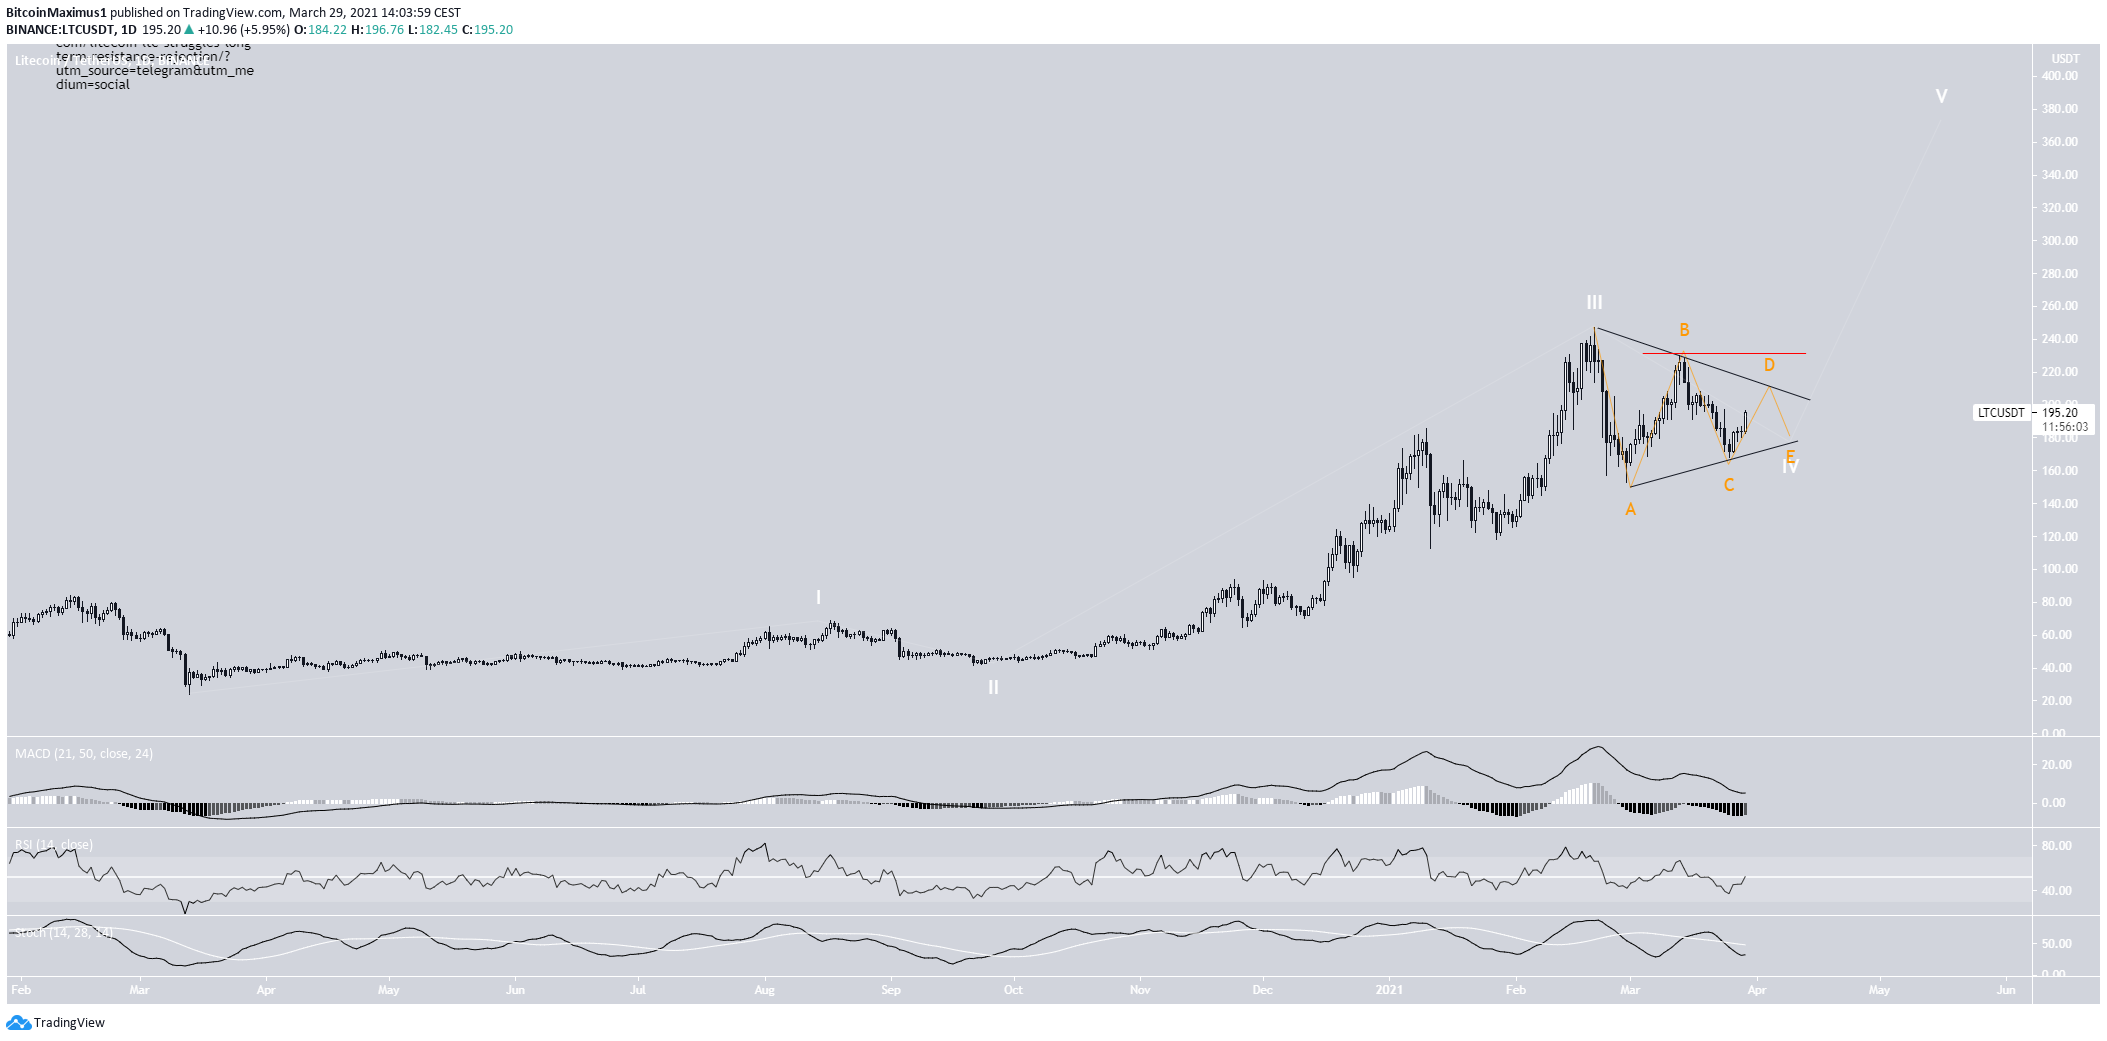
However, it seems that LTC is trading inside a symmetrical triangle, in what is likely wave four (white).
A breakout above the sub-wave B high at $231 (red line) would confirm that wave five has begun.
In that case, LTC would be expected to make another attempt towards its all-time high.
Highlights
- LTC is trading inside a symmetrical triangle.
- There is support and resistance at $175 and $246 respectively.
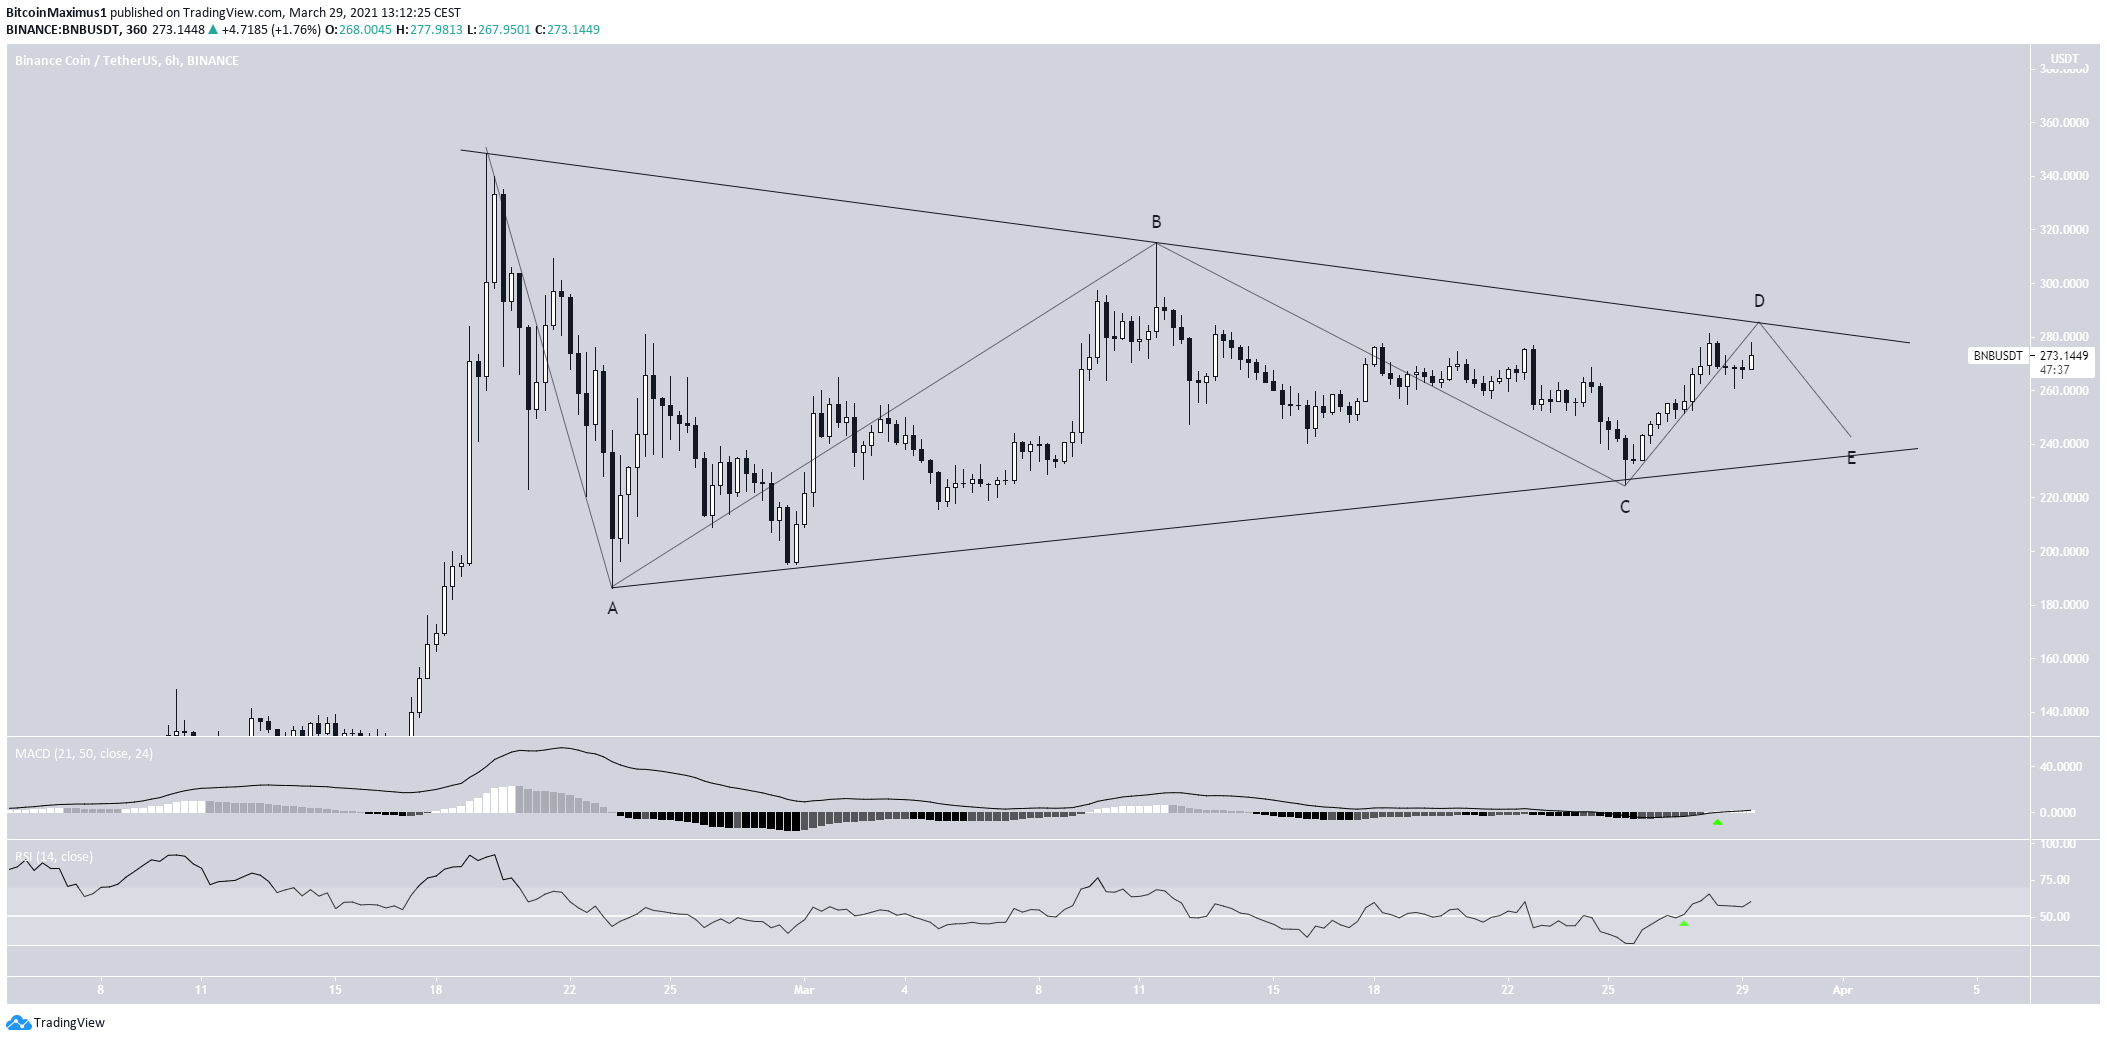
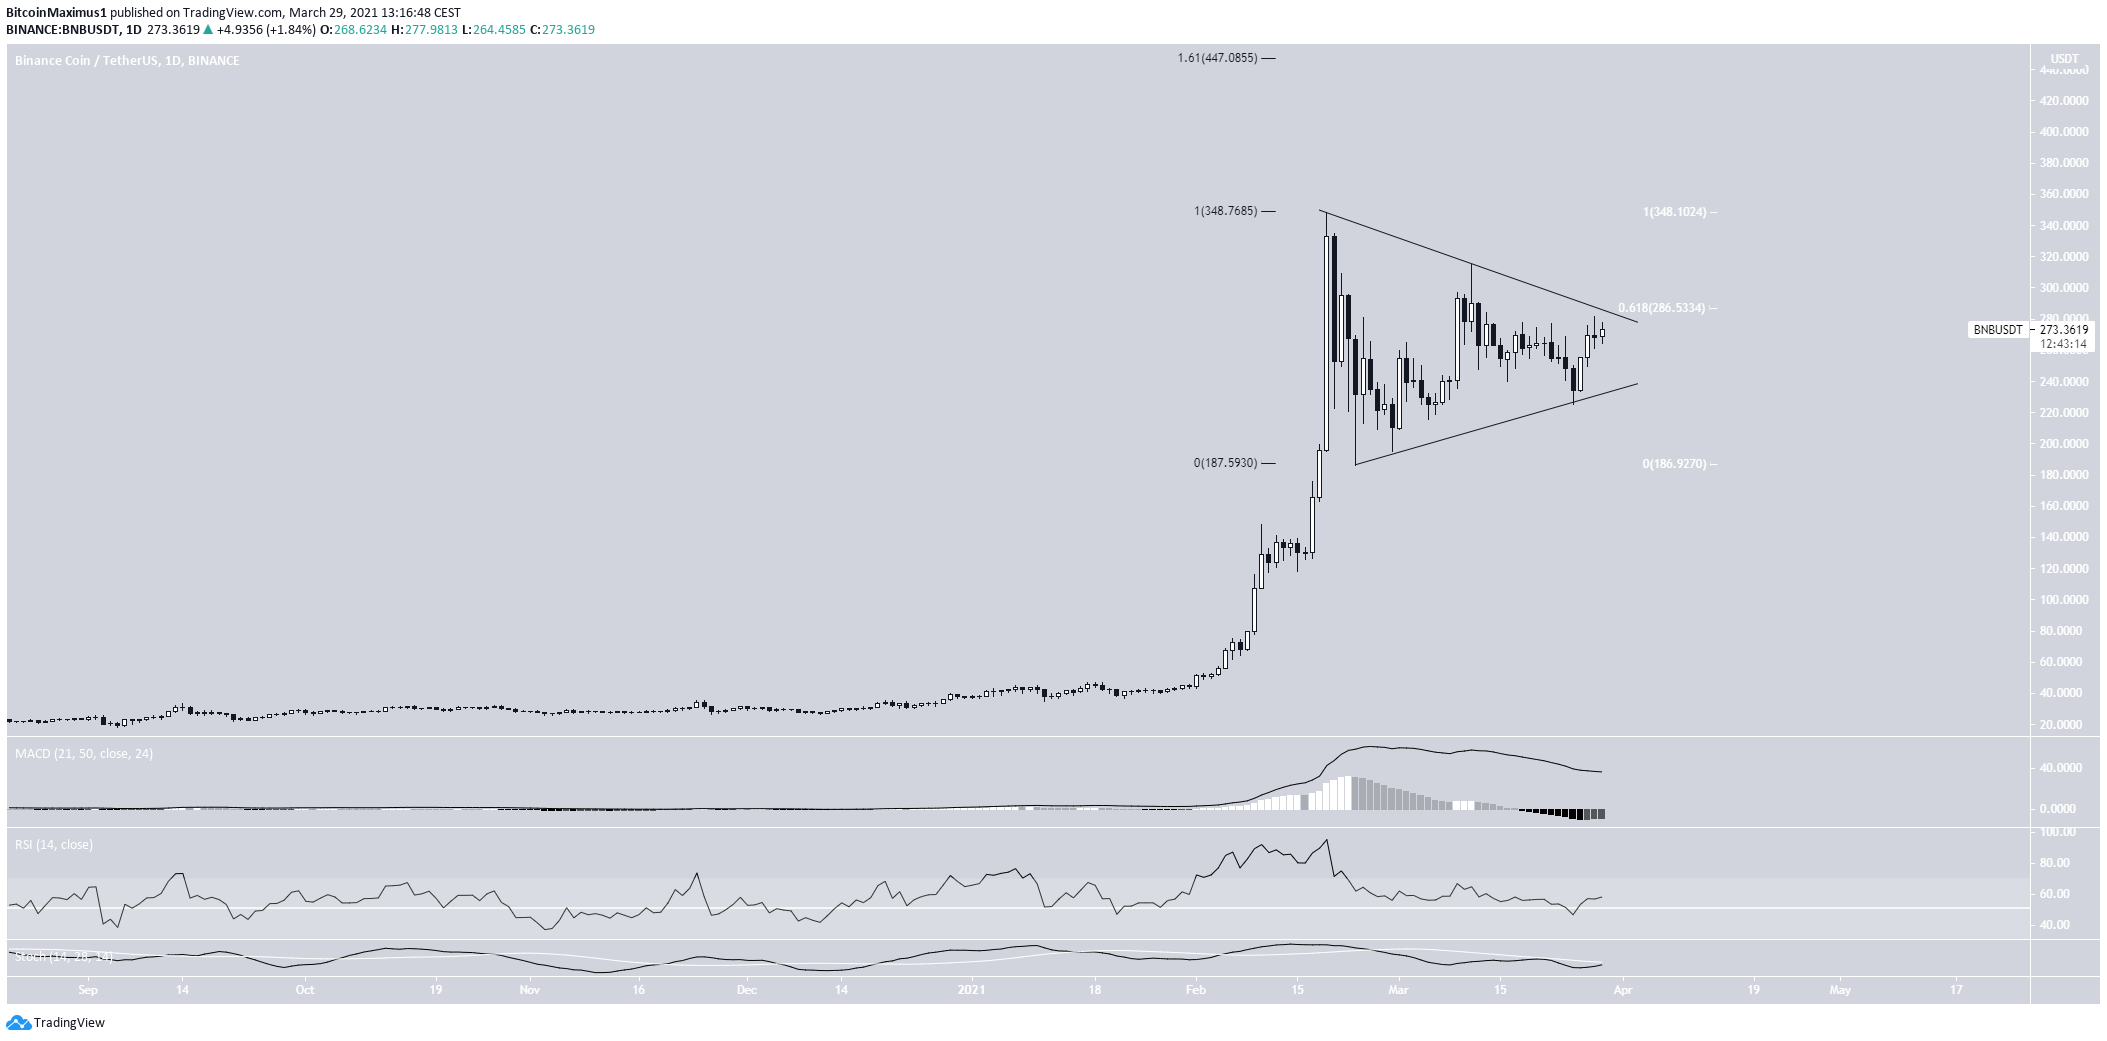
Binance Coin (BNB)
BNB has been decreasing since reaching an all-time high price of $348.69. It did so on Feb. 19.
It dropped sharply immediately afterward but has been consolidating since Feb. 23.
The movement looks like a symmetrical triangle, in which BNB is currently right at the resistance line. Short-term indicators are bullish.
Nevertheless, even if this is a triangle (not yet confirmed), another rejection would be expected before the breakout, which would complete the e wave.
In the daily time-frame, technical indicators are neutral. The RSI is right at the 50 line, and the Stochastic oscillator has yet to make a bullish cross.
Currently, BNB is trading right at the 0.618 Fib retracement resistance at $286. If it manages to break out, the token will find the next resistance area at $348 and $447 after that.
However, the preceding increase is completely parabolic, making it nearly impossible to determine the future movement’s direction.
Highlights
- BNB is trading inside a symmetrical triangle.
- Technical indicators are undecided.
For BeInCrypto’s latest bitcoin (BTC) analysis, click here.
Trusted
Disclaimer
In line with the Trust Project guidelines, this price analysis article is for informational purposes only and should not be considered financial or investment advice. BeInCrypto is committed to accurate, unbiased reporting, but market conditions are subject to change without notice. Always conduct your own research and consult with a professional before making any financial decisions. Please note that our Terms and Conditions, Privacy Policy, and Disclaimers have been updated.
