LTC Price Analysis: Bearish Waves Warns Litecoin Under $60?
Author: Sohrab Khawas 
Sohrab Khawas 
Author
Sohrab is a passionate cryptocurrency news writer with over five years of experience covering the industry. He keeps a keen interest in blockchain technology and its potential to revolutionize finance. Whether he's trading or writing, Sohrab always keeps his finger on the pulse of the crypto world, using his expertise to deliver informative and engaging articles that educate and inspire. When he's not analyzing the markets, Sohrab indulges in his hobbies of graphic design, minimal design or listening to his favorite hip-hop tunes.


Oct 19, 2023 14:59
Sohrab Khawas
Author
Sohrab is a passionate cryptocurrency news writer with over five years of experience covering the industry. He keeps a keen interest in blockchain technology and its potential to revolutionize finance. Whether he's trading or writing, Sohrab always keeps his finger on the pulse of the crypto world, using his expertise to deliver informative and engaging articles that educate and inspire. When he's not analyzing the markets, Sohrab indulges in his hobbies of graphic design, minimal design or listening to his favorite hip-hop tunes.
LTC price action shows a falling trend under the influence of 50-day EMA.
The downtrend gains momentum following the death cross in the daily chart.
A downfall below $60 will plunge the LTC price close to the psychological mark of $50.
The continuous downtrend for Litecoin and multiple altcoins in 2023 projects a strong resistance trendline. Leading to a streak of lower highs, the LTC price finally forms a solid footing close to $60, teasing a bounce back to reclaim trend control.
Therefore, despite the strong resistance trendline, the LTC price prediction holds a bullish torch in the coming months.
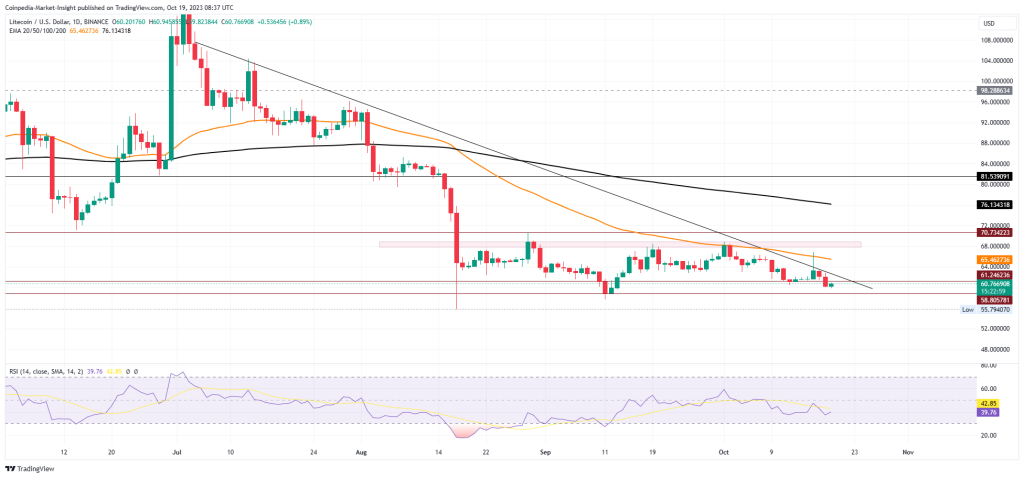
Taking a sideways stroll between the crucial levels of $60 and $72, the LTC price action reflects strong bearish pressure. Furthermore, the declining trend of the 50-day EMA rejects multiple breakout possibilities, leading to further delay.
With multiple failed attempts to rise and sustain above $72, the lower high formation finally starts within the sideways stroll. The recent long-wick candle taking rejection from the 50-day EMA marks a new negative cycle.
The LTC price is currently trading at $60.77 with an intraday growth of 0.91%, following the 4% drop over two days. As the buyers struggle to remain dominant over the $60 support zone, the chances of a reversal are pretty slim for Litecoin.
Technical indicators:
RSI indicator: The daily RSI line continues to trend sideways with no signs of divergence as it moves under the 14-day SMA.
EMA: The 50-day EMA acts as a dynamic resistance, keeping the bullish growth in check.
Will LTC Price Sustain Above $60?
If the Litecoin price fails to exceed the 50-day EMA, it will bring a new buying opportunity for sideline traders. Additionally, a breakout above the 50-day EMA will open up the possibility of a move to $70 before targeting $100.
If the downward trend continues, the price will break through the $60 level and test the bullish dominance at the $50 support level.