TRX Price Analysis: Will TRX Reach $0.10 With Sharp Moves?
Author: Sohrab Khawas 
Sohrab Khawas 
Author
Sohrab is a passionate cryptocurrency news writer with over five years of experience covering the industry. He keeps a keen interest in blockchain technology and its potential to revolutionize finance. Whether he's trading or writing, Sohrab always keeps his finger on the pulse of the crypto world, using his expertise to deliver informative and engaging articles that educate and inspire. When he's not analyzing the markets, Sohrab indulges in his hobbies of graphic design, minimal design or listening to his favorite hip-hop tunes.


Oct 4, 2023 14:21
Sohrab Khawas
Author
Sohrab is a passionate cryptocurrency news writer with over five years of experience covering the industry. He keeps a keen interest in blockchain technology and its potential to revolutionize finance. Whether he's trading or writing, Sohrab always keeps his finger on the pulse of the crypto world, using his expertise to deliver informative and engaging articles that educate and inspire. When he's not analyzing the markets, Sohrab indulges in his hobbies of graphic design, minimal design or listening to his favorite hip-hop tunes.

TRX price action displays a positive trend in motion following the $0.083 breakout.
The TRX price is rising with a triangle breakout rally in the weekly chart.
With the breakout rally gaining momentum, the TRX price may soon cross the $0.10 mark.
Sustaining an uptrend in 2023 is not a small feat in the crypto market, as the volatility and the bear market kept bulls under control. Nevertheless, the TRX price sustains a positive move, leading to a 65% YTD growth.
With the recent reversal from the support trendline breaking above the $0.083 mark, the uptrend continues to approach the $0.10 psychological mark. Due to such sharp bullish moves, the bullish anticipation of the TRON price prediction is on the rise.
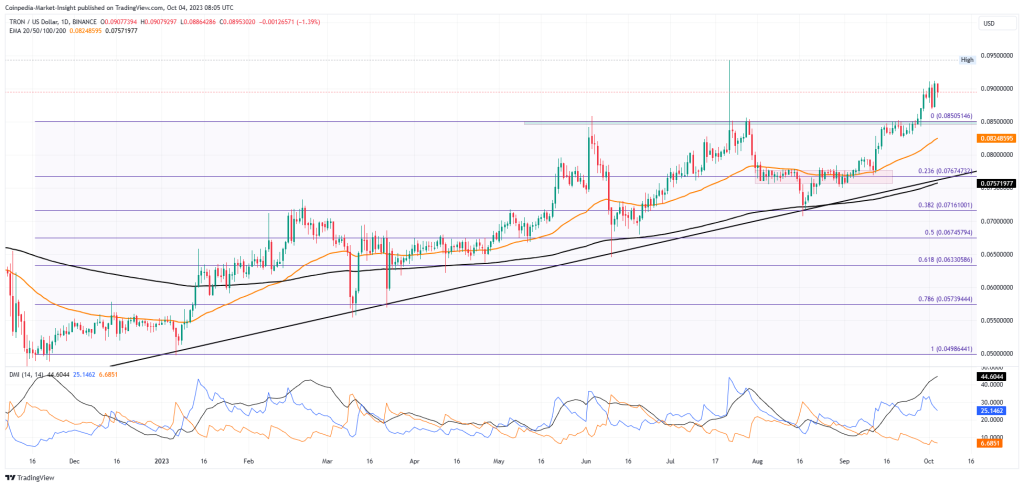
Taking a closer look, the TRX price action displays a rounding bottom breakout as the Tron price exceeds the $0.083 mark. As per the bullish pattern, the breakout rally can reach the $0.10 mark.
Currently trading at $0.089, the Tron price shows an intraday fall of 1.88% following the sharp jump of 4.10% last night.
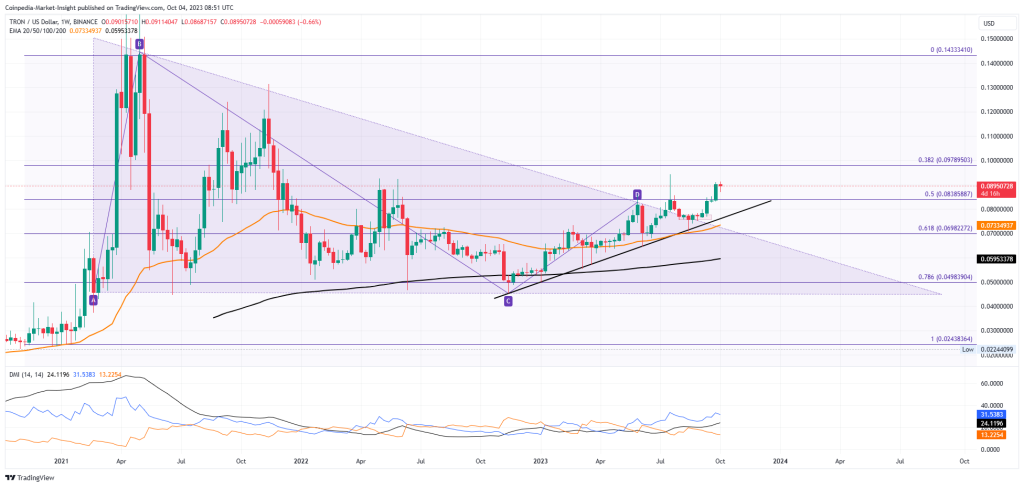
Moving on to the weekly chart, the TRX price displays a strong uptrend in motion. Moreover, the uptrend gives a bullish breakout of a descending triangle pattern and ends the lower high formations since 2021.
As Tron shows a potential to reclaim the 2021 price levels, the upside continuation approaches the 38.20% Fibonacci level at $0.097.
Technical Indicators:
DMI Indicator: With the ADX line rising in the weekly and daily TRX price chart, the bullish momentum is rising for the TRX price. Moreover, the DI lines remain positive in both charts.
EMA: Maintaining an uptrend in the daily chart, the 50 and 200-day EMA provide constant support to the high momentum rally. Following the golden crossover, the EMAs certify the uptrend in Tron.
Will TRON (TRX) Price Reach $0.10?
As the buying pressure continues and the overall market recovers, the TRX price might soon surpass the $0.10 mark. This would create a new swing high in 2023.
On the contrary, if bears dominate the 38.20% Fibonacci level at $0.097, a reversal may emerge. This could challenge the bullish dominance at $0.083.