Stellar Price Analysis: With A Double Top In The Picture, XLM Price Struggles Above $0.14!
Author: Elena R 
Elena R 
Author
Elena is an expert in technical analysis and risk management in cryptocurrency market. She has 10+year experience in writing - accordingly she is avid journalists with a passion towards researching new insights coming into crypto erena.

Aug 2, 2023 14:13
Elena R
Author
Elena is an expert in technical analysis and risk management in cryptocurrency market. She has 10+year experience in writing - accordingly she is avid journalists with a passion towards researching new insights coming into crypto erena.

Failing to rise above the $0.16 resistance level, the XLM coin price forms a double-top pattern in the daily chart. The bearish pattern forms a neckline close to the 23.60% Fibonacci level at $0.142, coinciding with a solid crucial support zone.
The long-wick formation candles at $0.16 represent enormous supply pressure, representing investors ready to book profit above $0.16.
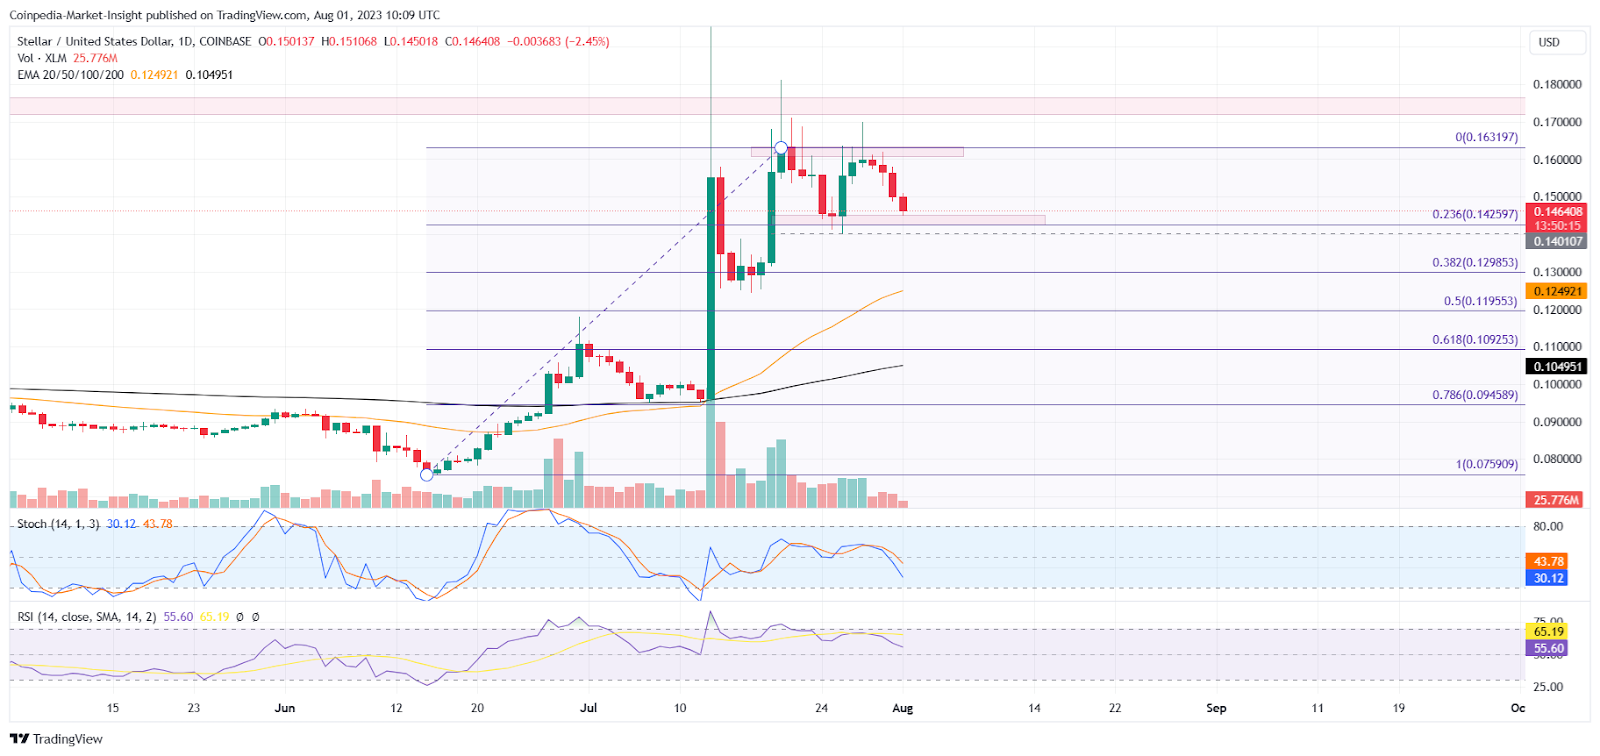
The stellar coin price falls by 7.79% over the last four days forming consecutive bearish candles, increasing the downtrend possibility below $0.142. Currently, the XLM coin price trades at $0.1472 with an intraday fall of 1.88%, close to the double top neckline. This warns of a bearish breakdown.
The fallout rally will plunge the XLM prices to the crucial bullish support at the 38.20% Fibonacci level at $0.1298.
On the flip side, a positive recovery with lower price rejection can keep the Stellar coin price floating above $0.14. It can help the XLM price trend bounce back to $0.16 for a new bullish breakout attempt.
The stochastic indicator displays the K and D lines giving a bearish crossover and keeps falling from the overall territory reflecting a solid bearish trend. Moreover, the RSI indicator displays the daily RSI line falling toward the halfway line as it reverses from the overbought territory. Therefore, the technical indicators maintain a bearish perspective for the future trend of XLM price.